Any views or opinions presented in this article are solely those of the author and do not necessarily represent those of the company. AHP accepts no liability for the content of this article, or for the consequences of any actions taken on the basis of the information provided unless that information is subsequently confirmed in writing.
Pharmaceutical pricing is a topic rife with contradictions:
- Pills that cost pennies to produce may cost thousands of dollars to purchase
- Two pills with identical ingredients, but different names, may vary in price by a factor of five
- In the United Stated, the price of the same drug may vary by two times or more compared to what it costs other countries
However, these bewildering characteristics of pharmacy prices are not unexplainable. Pharmaceutical pricing is a natural consequence of the way pharmaceutical products are researched, manufactured, and paid for. Understanding the details and complexities of this pricing is a necessary first step in supporting the creation of potential cost-saving approaches. This paper will briefly explore the structure of the pharmaceutical industry, investigate the layers of pricing between manufacturers and consumers, and highlight various approaches to managing drug prices in both the United States and throughout the world. Throughout the paper, the drug Lipitor will help illuminate the path of a drug from the laboratory to the pharmacy.
Pharmaceutical Profits
Two unique aspects of the pharmaceutical industry are (1) the amount of research and development (R&D) investment and (2) the patent system. In 2016, the top 10 largest pharmaceutical companies spent just over 17% of their revenue on research1. This is compared to 3% in Aerospace and Defense, 9% in Computing and Electronics and 12% in Healthcare overall.2 This huge investment in R&D is necessary for a pharmaceutical company to be able to finance the development of future drugs. During the development process, many potential drugs have ineffective clinical outcomes or serious side effects. Including the cost of drugs that were not approved, the cost of developing a single FDA-approved medication was recently estimated at $2.87 billion dollars (in 2013 dollars).3 This large upfront outlay and considerable uncertainty in the drug development process means that a very high return is sought by investors in drug companies to compensate for these risks.
The pharmaceutical industry routinely appears at the top of “most profitable industry” lists.4 The large profits associated with the pharmaceutical industry are also related to the second unique aspect of this sector, the patents which protect drug discoveries. The major impetus driving research and development spending is the prospect of developing a blockbuster drug (i.e., an innovative drug that treats a serious condition with a large number of patients in economically-advanced countries). Such a drug recoups its large R&D expense many times over, which then funds less-successful drugs and provides profit to drive future investments. In 2015, 12 drugs had sales of over $5 billion a year. The two most successful had sales in excess of $10 billion5. Patent protection ensures multiple years of exclusive access to market these medications to a large population.
| Lipitor, the cholesterol medication, is an example of a blockbuster drug. It dominated drug sales between its release in 1996 till the end of its patent protection in 2011.6 While Lipitor started early clinical trials in 1985, it wasn’t available commercially until 1996. |
Lipitor, the cholesterol medication, is an example of a blockbuster drug. It dominated drug sales between its release in 1996 till the end of its patent protection in 2011.5 While Lipitor started early clinical trials in 1985, it wasn’t available commercially until 1996.
Patent protection is a central driver of pharmaceutical industry economics. In drug production, there are high initial costs to develop a unique medication, but often very low marginal manufacturing costs after the medication has been developed. In the absence of any patents, manufacturers would inexpensively produce any invented drug and prices would approach the costs of production. In the long run, the lack of patents would remove the incentive for pharmaceutical companies to invest in research and development and we would be limited to public funding of research and the existing drug catalog.
| The generic version of Lipitor is Atorvastatin. While manufacturing of Lipitor was controlled by Pfizer, Atorvastatin is currently manufactured by hundreds of companies worldwide. |
The generic version of Lipitor is Atorvastatin. While manufacturing of Lipitor was controlled by Pfizer, Atorvastatin is currently manufactured by hundreds of companies worldwide.
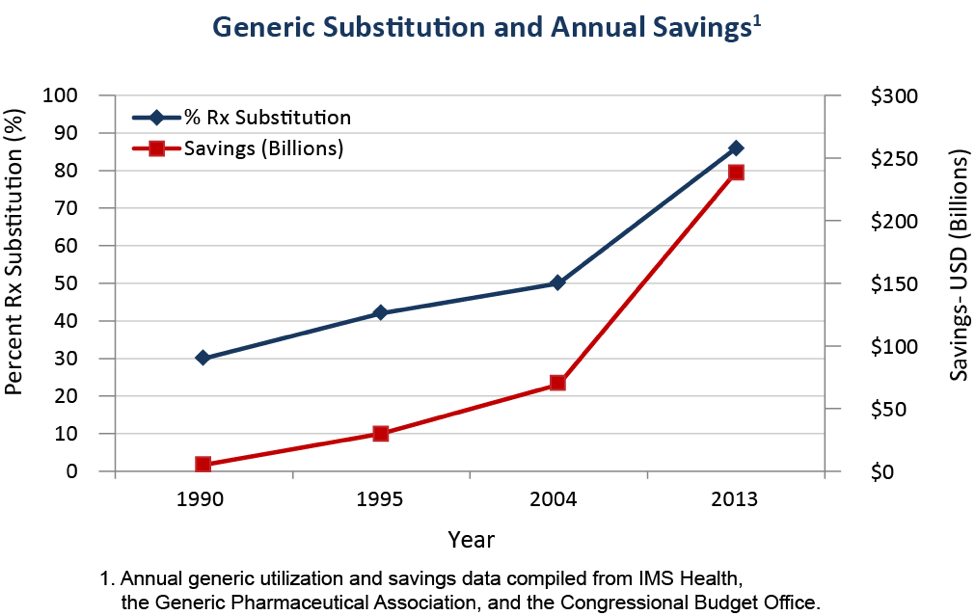
The current pharmaceutical market structure is a combination of patent-protected brand-name drugs, where manufacturing is controlled by the firm holding the patent, and generic drugs, where the exclusive patent has expired and any manufacturer meeting minimum requirements may produce the drug. Over time, the number of generic medications has increased as more and more popular brand name drugs lose their patent protection. The following graph shows the rapid increase in the percent of prescriptions filled with generic drugs over time.7
Pharmaceutical Pricing Life Cycle
In discussing the structure of the pharmaceutical industry above, frequent reference is made to drug prices, suggesting that there is a single “price” for a drug that is known by all participants. The reality of drug pricing is that there are many different prices depending on who is buying, who is selling, and when and where the transaction takes place. The range of different prices paid in the market helps identify the many players beyond the manufacturer and final consumer.
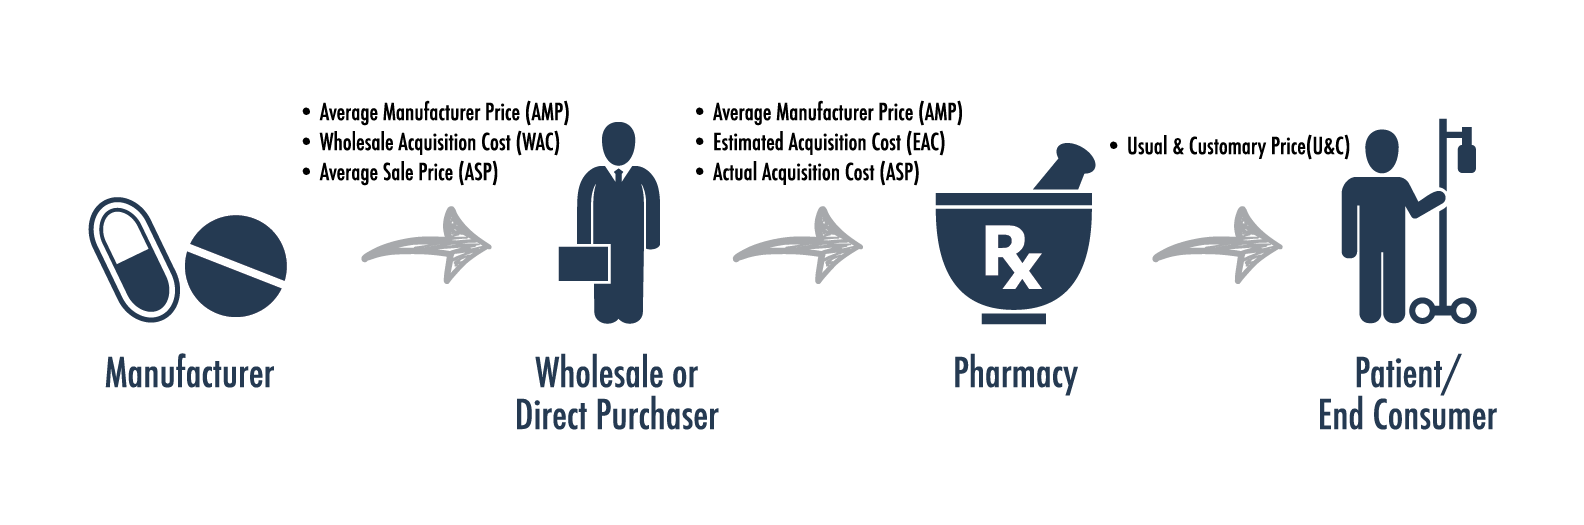
The major purchasers of drugs from manufacturers are not patients or pharmacies but wholesalers. While major pharmaceutical companies are often well-known brands (Johnson & Johnson, Pfizer, Merck) the biggest wholesalers are rarely known by the public (AmerisourceBergen, Cardinal Health, etc.). Wholesalers account for 85% to 90% of drug manufacturer revenues and purchase drugs directly from the manufacturers for sale to pharmacies, hospitals, physician offices and stand-alone clinic8. The price wholesalers pay to purchase drugs from manufacturers is called the Average Manufacturer Price (AMP) or Wholesale Acquisition Cost (WAC)9.
The next stage in the drug distribution pipeline is the sale of pharmaceuticals from wholesalers to retailers. Focusing on pharmacies that sell directly to consumers, the price that retailers pay is often known as the Actual Acquisition Cost (AAC). The AAC is typically based on the WAC plus a markup (often 10-15% on branded drugs and higher on generics). Average Wholesale Price (AWP) is another benchmark for the price pharmacies pay wholesalers. AWP is a universal standard in pharmaceutical pricing and is typically collected and published by companies who collate drug pricing data.
The last step is getting medications into the hands of consumers. This is handled through several chain and local retail pharmacies as well as an increasing number of mail and specialty pharmacies. The retail pharmacy market in the US is largely dominated by chain pharmacies;. In 2014 the top three pharmacy chains (Walgreens, CVS Health and Rite Aid) accounted for over 75% of the market share10. An increasing volume of drugs are being dispensed through the mail order channel, especially with the expansion of specialty drug utilization. The price of retail medications to consumers is the “Usual and Customary” (U&C) price, which includes the cost of the drug (AAC) plus the pharmacy’s markup, the pharmacy typically also receives a dispensing fee of $1-$3 per prescription11. The image to the right shows the various prices encountered between the manufacturer and the final consumer.12
The Role of Insurers and Pharmacy Benefit Managers
An area of pharmacy pricing not addressed above is the role of insurers and pharmacy benefit managers (PBMs) in drug purchasing and pricing. Typically, consumers who have pharmacy insurance coverage pay a copay or a percent of a drug’s cost and the remainder is covered by their insurance. The proportion of pharmacy costs covered by insurance is often lower than for other medical services, but it has risen in recent years, especially for costly specialty medications. Insurers entered the pharmaceutical market to use their market power to reduce the prices they pay for drugs. Over time, though, many insurers have outsourced this role to PBMs, which negotiate drug prices on behalf of insurers and large employers.
PBMs work on behalf of their clients to lower the prices paid for pharmaceuticals. They interact in the pharmaceutical market through two primary paths: price negotiation and formulary design. The first part of price negotiation is reducing the prices paid at the pharmacy through discounts. PBMs aggregate the purchasing power of multiple insurers and payers to negotiate better discounts with pharmacies than insurers could achieve on their own. The PBMs may also own or contract with mail-order pharmacies that offer even deeper discounts.
| Pricing Example – Brand | Pricing Example – Generic | ||
| Lipitor (Bottle of 30, 10mg, circa 2011) | Atorvastatin (Bottle of 30, 10mg, circa 2016) | ||
| AWP | $120 | AWP | $100 |
| Brand Discount | 20% | Generic Discount | 80% |
| Dispensing Fee | $2 | Dispensing Fee | $2 |
| Cost at Pharmacy | $120 * (1-20%) + $2 = $98 |
Cost at Pharmacy | $100 * (1-80%) + $2 = $22 |
| Member Copay | $30 | Member Copay | $5 |
| Rebate | $12 | Rebate | $0 |
| Cost to Insurer | $98 – $30 – $12 = $56 | Cost to Insurer | $22 – $5 – $0 = $17 |
While discounts reduce the initial price paid at the pharmacy, rebates earn money back after drugs have been sold and consumed. Drug rebates are negotiated directly with manufacturers on brand medications by PBMs. They often total 10% or more of the price of branded drugs. Manufacturers pay rebates to earn access and to reward volume. Access means that a PBM lists a medication on their formulary as a “preferred” brand drug, meaning it costs less to the consumer and will be more likely to be prescribed by physicians. Volume rebates are additional rebates paid by the manufacturer if a PBM sells more of their brand drug than similar alternatives. A decade ago many PBMs provided their services for a nominal fee and earned most of their money through rebates., Today, most PBMs charge higher upfront fees and pass-thru rebate payments to the insurer.
Insurers and PBMs offer a range of services beyond price negotiations. They also work on formulary design (the list of drugs covered by an insurance plan) and cost saving programs. Programs include compliance programs to ensure pills are taken regularly and prescriptions filled promptly, generic substitution to recommend generic versions of brand drugs, and polypharmacy, which focuses on safety for patients taking a large number of medications.
Pharmaceutical Pricing Abroad
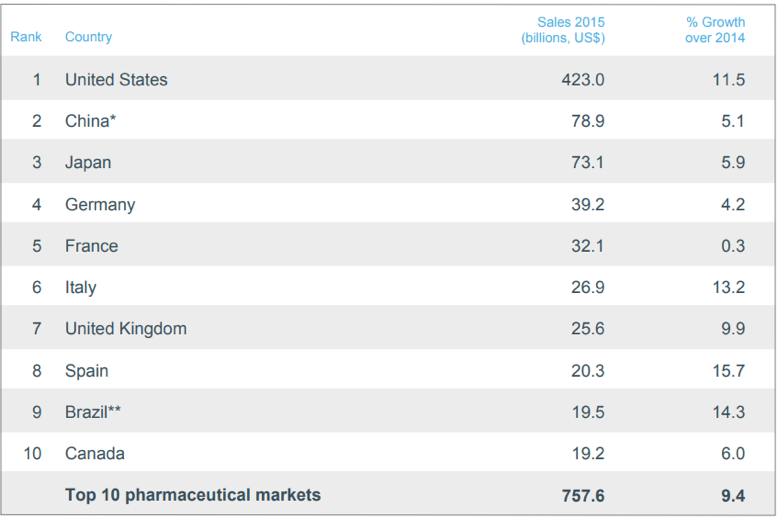
The pharmaceutical industry is a truly international industry with drug research and development, manufacturing, and distribution occurring across national borders. The US drug market is far and away the most valuable in terms of revenues due to the US’s large population and high per-capita GDP. The following table shows the value of the top 10 pharmaceutical markets, measured by revenues in US dollars (USD) for 201513. The relative size of drug markets also reflects different healthcare practices and drug price controls in each country.
In the United States, the FDA is responsible for approving new medications. Pharmaceutical companies must submit extensive documentation and research supporting safety and efficacy to have a drug approved. The FDA does not, however, consider whether a drug is reasonably priced compared to drugs in the same therapeutic class or existing medical treatments. In many European countries, drug approval is a two-step process, with initial approval based on safety and efficacy and a second step that considers the drug’s cost effectiveness compared to other available medications and treatments.
When appraising the landscape for drug sales, manufacturers consider not only where to set prices in each country, but the size of markets and prices across the entire world. Drug manufacturing requires huge upfront research costs and relatively low marginal production costs. Manufacturing firms need to make enough money, in aggregate, to cover initial research costs, but the marginal cost they charge only needs to be enough to cover production. This means that lower income countries can often purchase drugs for 1/10th or less of the cost of high income countries. This is a boon for many countries in South America or Africa, where the level of incomes is insufficient to support high drug prices, but leads manufacturers to price discriminate across markets and may lead to a sense that some markets are subsidizing others.
A study of drug price differences across nations carried out by Kanavos and Vandoros in 2011 found that brand drug prices did appear higher in the United States than in European countries, but that the difference was lower than that found in prior studies.14 In most other countries with socialized health insurance systems, there is some level of drug price negotiation at the national level. Germany allows drug companies to set their own initial prices but may set maximum prices for patent-protected drugs, use references prices for drugs in a therapeutic class, require initial use of alternate treatments or deny reimbursement of “inefficient drugs”.15 In the United Kingdom, the National Institute for Health and Care Excellence (NICE) determines both the clinical value of a drug and its cost effectiveness. Only drugs meeting minimum cost effectiveness requirements are reimbursed by the National Health System, meaning drugs that don’t meet this requirement are essentially unavailable to the public.16 In Canada, a range of price management tools are available. Drugs are initially categorized as “Category 1: a new drug product that is an extension of existing or comparable dosage form of an existing medicine; Category 2: the first drug to effectively treat a particular illness or that provides a substantial improvement over existing drug products; Category 3: a new drug or dosage form of an existing drug that provides moderate, little, or not improvement over existing drugs.”17 Drugs are then assessed as to whether their prices are “excessive”, existing drugs are limited to an annual CPI (Consumer Price Index) increase, new drugs in categories 1 and 3 must be within the range of existing drug prices in their therapeutic class and the price of breakthrough drugs is based on a reference to the price in other countries.
Controlling Prices in the US: Options
How can the US decrease drug prices? One frequently-cited idea is to allow importation of inexpensive drugs from Canada. Many individuals have driven over the border to purchase cheaper drugs in Canada and even made online purchases from Canadian pharmacies. In individual cases, this certainly saves money, but as a national strategy it would be difficult for the United States to process its drug purchases through a country 1/9th the size. The likely response by drug manufacturers would be to limit drug production and sales to Canada or to raise prices in Canada to make up for the lost revenue. Either case would likely hurt Canadian consumers and could lead to the passage of laws in Canada outlawing the exportation of drugs to the United States.
What if the United States instituted its own Canada-style drug price controls at a national level? With almost 50% of the international market, the US could certainly lower drug prices by leveraging its market power. As the largest market and a relatively high-priced market, the US likely supplies even more than 50% of total pharmaceutical profits. As these profits are reduced through drug negotiations, the long-term return to drug research and development would decrease leading to corresponding decreases in investment. This would reduce the rate of new drug breakthroughs throughout the entire world.
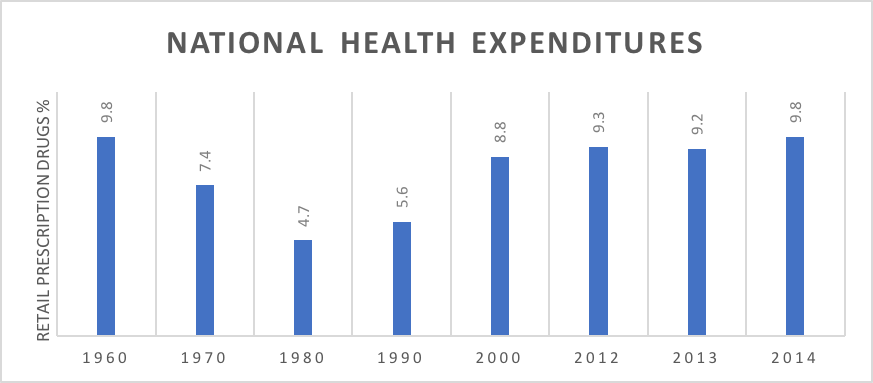
What should the US do? How can payers control drug prices over time without the US shouldering an outsize portion of the cost of drug development and without decreasing investment in drug breakthroughs? The first issue is to assess the size of the problem, while recent drug trends have been higher than medical trends, in the long run the proportion of US health spending dedicated to pharmaceuticals has remained relatively constant (see chart below).18
To search for effective methods to control pharmaceutical costs we should look at what has found success in other countries and the methods successful PBMs are currently pursuing:
- Encouraging/mandating generic substitution.
- Tying the cost of new drugs in existing therapeutic classes to the drugs already being sold (referencing pricing).
- Comparing the cost of novel drugs to the cost of existing medical treatments for those conditions.
- Negotiating rebates or agreements from manufacturers that limit the growth rate of drug prices over time.
- Establishing a pathway for effective biosimilars to be approved as specialty drugs lose patent protection.
- Investigating outcomes-based payment arrangements for costly specialty drugs.
- Boosting competition for generic drug production.
Conclusion
Managing drug costs over time is a complex task that touches issues that run the gamut from increasing drug prices, generic drug shortages, long-term research and development, and national drug pricing policy. Any approach to improving the value of health expenditures spent on medications must consider the structure of the pharmaceutical industry, the history of health insurance in the US and the international market for drug development and manufacturing. Focusing on methods that have been effective internationally and within US markets may help control drug prices in the US and ensure a robust pharmaceutical market for the future.
1Ben Adams, Fierce Biotech, “The Top 10 pharma R&D budgets in 2016”.
2Strategy&, “Comparison of R&D Spending by Regions and Industries”.
3DiMasi, et. al., Journal of Health Economics, “Innovation in the pharmaceutical industry: New estimates of R&D costs”.
4Liyan Chen, Forbes, “The Most Profitable Industries in 2016”.
5Associated Press, Crain’s New York Business, “Lipitor becomes world’s top-selling drug”.
6Stephen Ostroff, M.D., US Food & Drug Administration, “Building a Modern Generic Drug Review Process”.
7MDM, “2016 MDM Market Leaders | Top Pharmaceuticals Distributors”.
8Laura Coe, Society of Actuaries, “Prescription Drug Pricing”.
9Drug Channels, “2014’s Top Retail Pharmacy Chains, According to Drug Store News”.
10Laura Coe, Society of Actuaries, “Prescription Drug Pricing”.
11Joey Mattingly, U.S. Pharmacies, “Understanding Drug Pricing”.
13IMShealth, “Top Pharmaceutical Markets Worldwide, 2015”.
14Kanavos & Vandoros, Health Econ Policy Law, “Determinants of branded prescription medicine prices in OECD countries”.
15Busse, WHO Regional Office for Europe on behalf of the European Observatory on Health Systems and Policies, “Health care systems in transition: Germany”.
16Cancer Research UK, “How NICE makes decisions”.
17Devidas Menon, HealthAffairs, “Pharmaceutical Cost Control In Canada: Does it Work?”
18CDC, Health, United States, 2015, “Table 94: National health expenditures, average annual percent change, and percent distribution, by type of expenditure: United States, selected years 1960-2014”.