Too often meaningless and unnecessarily complex healthcare analysis is prepared and presented to leadership without explaining what it means or answering the key question “what do I do with this?” Embedding a simple benchmarking analysis provides actionable information and gives direction to the organization. Too often actuaries are the culprits seemingly worshipping their analytic output and missing the key point of their work product.
Case Study
Health plans capture immense amounts of claims data and one of their critical needs is understanding how they are doing. Loss ratio reports are simple to prepare and quickly show performance compared to premium rates. The simple inclusion of a target loss ratio in these reports immediately shows whether or not they are achieving their financial goals. This requires little effort but is so often ignored. If the observed loss ratio is greater than desired, the actuary is often asked to dig deeper and help identify the source of the problem.
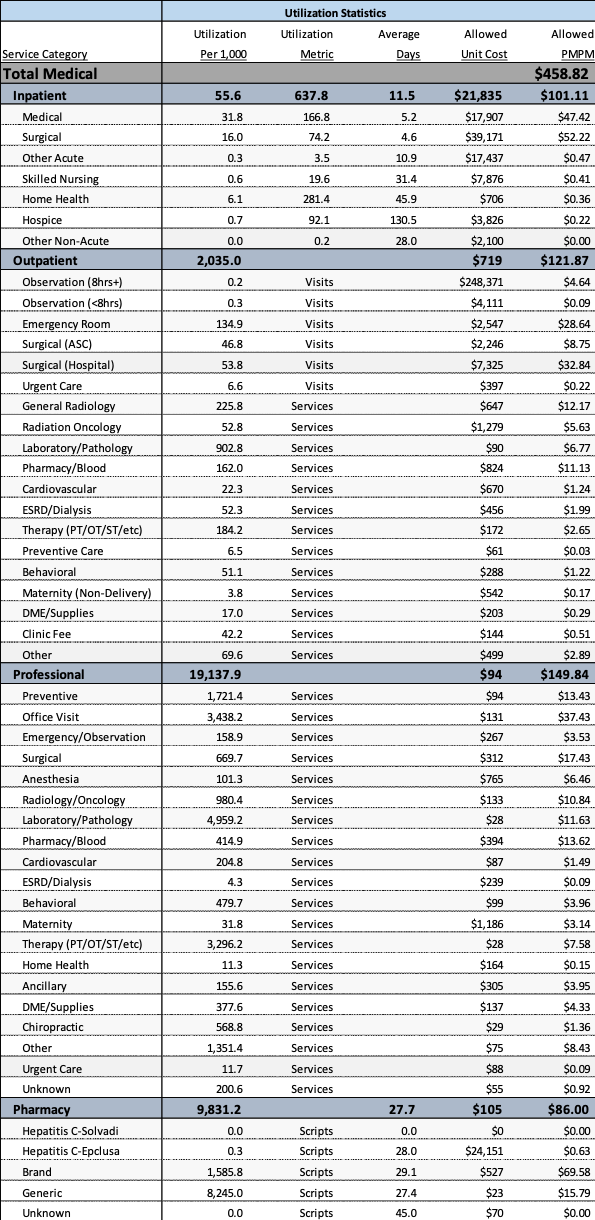
The frequently answer to this is developing what is known as an actuarial cost model. Table 1 shows an example of such a model. These models summarize both utilization and cost by category of service and often express the results in per member per month (PMPM) values. Table 1 shows experience from a commercial population with an overall PMPM cost of $458.82. Information is presented for each of the key categories of service with appropriate subtotals.
This presents very useful information and to the trained eye some very interesting information. However, the inclusion of this information alone would not provide beneficial and actionable information. However, some simple comparisons to reasonable benchmarks significantly improve the value of this type of information.
For example, lets first extract some key information from Table 1. The four most useful bits of information from Table 1 are:
- Hospital Inpatient acute care stays
- Emergency Room
- Office Visits
- Pharmacy
Table 1 Sample Actuarial Cost Model
Table 1 shows the following information for each of these categories.
- Hospital Inpatient acute care stays: Combining all of the acute care inpatient information results in the information in Table 2.
Table 2 Acute Care Inpatient Information
Table 2 shows an acute care admit rate of about 48 admits/1,000, a days rate of about 245 days/1,000, and an average length of stay (LOS) of 5.1 days. On a risk adjusted basis, these results can be directly compared to ideal benchmarks for the best observed health care system. Table 3 presents such a comparison.
Table 3 Acute Care Benchmark Analysis
Table 3 immediately shows that there is a LOS problem, a significant number of potentially avoidable days. Admits are close to the ideal norm. Incorporating initiatives that reduce LOS will have a significant improvement in results. For example, the $100.11 acute care PMPM cost could be reduced by $31.51 if a 3.5 day length of stay was achieved, a 31% reduction in acute care and a 7% overall reduction in PMPM cost. Experience shows that 2/3rds of the total cost saved tends to be in the acute care area suggesting an overall potential savings of 10.5% if this is achieved.
- Emergency Room: Table 1 shows an overall utilization rate of 134.9 ER visits/1,000. The Ideal benchmark utilization is 80 ER visits/1,000. This suggests that about 40% of the current visits are potentially avoidable. The ER PMPM cost could be reduced by $11.65 if these avoidable visits were eliminated. This improvement would reduce overall costs by about 2.5%.
- Office Visits: Table 1 shows office visit utilization of 3,438 visits/1,000. The ideal benchmark office visit utilization is 3,000 visits/1,000. Even with longer than average LOS in the hospital, and higher ER visits, there is a higher than desired office visit utilization. Reducing this to a more appropriate level would result a savings of about $5.33, or an overall savings of about 1%.
- Pharmacy: Table 1 shows pharmacy utilization of 9,831 scripts/1,000. The ideal benchmark pharmacy utilization is about 8,000 scripts/1,000. Reducing pharmacy utilization to ideal levels would result in a $16.02 savings, or an overall savings of about 3.5%.
The basic conclusions of this sample analysis can be summarized as follows:
- A definite need to reduce LOS
- A definite need to reduce the unnecessary use of emergency rooms
- The higher office visit utilization is leading to higher pharmacy utilization
- There is an opportunity for more than a 10% reduction in overall PMPM claims cost.
- There are significant care management opportunities at this health plan.
Summary
The initial report presented as Table 1 can be enhanced by targeted comparison of these four different areas. The conclusions are obvious and provide actionable and strategic targeted areas to promptly improve the overall performance of the health plan.
Focusing on these four critical areas will help direct action to the most opportunities.
Any views or opinions presented in this article are solely those of the author and do not necessarily represent those of the company. AHP accepts no liability for the content of this article, or for the consequences of any actions taken on the basis of the information provided unless that information is subsequently confirmed in writing.


