
Any views or opinions presented in this article are solely those of the author and do not necessarily represent those of the company. AHP accepts no liability for the content of this article, or for the consequences of any actions taken on the basis of the information provided unless that information is subsequently confirmed in writing.
Introduction
Benchmarks are very useful and a great tool for deciphering analytics. They offer a point of reference to which we can compare and identify cost and quality improvement opportunities. Most of the time benchmarks are calculated a national, industry, or statewide level. These benchmarks are often preferred when looking to compare to industry standards. However, these broad benchmarks may not always be applicable to your data or available for your use. When standard benchmarks are not a good option it doesn’t mean you’re out of luck; you can develop benchmarks from your own population.
When standard benchmarks are not a good option it doesn’t mean you’re out of luck; you can develop benchmarks from your own population.
The purpose of this article is to discuss approaches you can take when benchmarks are either not available or not applicable for your use.
When is it not appropriate to use a standard benchmark?
There are many factors to consider when deciding to use a benchmark. While utilizing benchmarks to review analytics, you need to ensure the benchmark is relevant to both the population and the metrics you are reviewing. Important considerations and questions to ask about a benchmark include:
- Geographic Differences: Does your benchmark incorporate geographic adjustments to differences in the population you’re analyzing?
- Comparing a national benchmark to a rural population may lead to a discrepancy as the benchmark will not account for a decreased number of physicians and increased travel distances in rural communities. This may lead members to only seek out services for more severe conditions.
- Demographics: Does your benchmark properly incorporate age and gender mix of the population you’re analyzing?
- Some standardized benchmarks are developed using a Medicare dataset. If these benchmarks are not adjusted properly, they may lead to a variance when comparing to a younger commercial population.
- Market Restrictions: Does your population’s market have additional restrictions which may limit a benchmark?
- Various states, areas, and markets will have different prescribed regulations and laws that need to be accounted for. A nationwide benchmark might not reflect a variance to your population due to a required regulation.
- Socioeconomic Differences: Does the benchmark population have socioeconomic characteristics similar to the population you’re measuring?
- A standardized benchmark that comes from a large nationwide commercial population may not be applicable to a population of subsidized ACA policies.
- Point in time: When was the benchmark established? Have there been significant changes over time that would affect the accuracy of the benchmark?
- In recent years there have been many new laws and regulations surrounding healthcare. If a benchmark was established prior to these new requirements the standardized benchmark may not be useful to your population.
- Method and Unit of Measurement: Are the benchmark cost categories or measurement units in line with the cost categories and measurement of your population?
- When comparing to a standardized benchmark that is only available at the total medical level you may be unable to determine whether Inpatient, Outpatient, Professional, etc. services are driving your costs.
National, industry, and statewide standardized benchmarks are often the preference when using a benchmark due to their credibility; however, after taking everything under consideration these benchmarks may not be relevant to the population data with which you are working. When a comparison metric doesn’t seem relevant to the user of the information, there is little value to be gained from completing the comparison. If the standardized benchmarks are not appropriate to measure against, you may want to consider developing your own internal benchmarks.
What can you do if there are no relevant benchmarks?
If you find standardized benchmarks are not relevant to the population you’re measuring, you can develop your own benchmarks from internal data. Developing your own benchmarks from internal data requires a large enough data set to provide a credible baseline. Having benchmarks developed from your own internal data will allow you to compare sub-populations to the benchmark with confidence.
Once you have made the decision to develop internal benchmarks you must decide which method you would like to use. There are two main methods that can be used to develop a benchmark. One method is to develop a benchmark based on the average of your metric from your internal data and use this as the benchmark. A second method is to calculate the best in class metric from your internal data and use this as your metric. Both methods of developing an internal benchmark are valid and can be preferred during different scenarios. When using benchmarks to affect physician behavior the best in class metric can be used as a target for improvement, while the average could be used as a baseline metric to be included in an incentive arrangement.
Case Studies
Suppose you’ve found the standardized national and industry-wide benchmarks are not applicable to your population, and you have developed internal benchmarks. Now what can you do with them? Below are two brief case studies that show different scenarios when internal benchmarks are more ideal, and how you can effectively use those results.
Case Study 1
Comparing sub-populations of a larger population can give you greater insight into the main drivers of cost of business.
In this case study, we are looking at emergency utilization in a single Medicare Advantage market where there are five different attributed provider populations. We are wondering which providers are optimizing the utilization of various levels of care (e.g., telehealth, primary care, urgent care, emergency room), as well as where there may be opportunities to implement best practices. The graph below shows the ER visits/1,000 rates for each of the five attributed provider populations as well as the national benchmark for this metric.
Graph 1
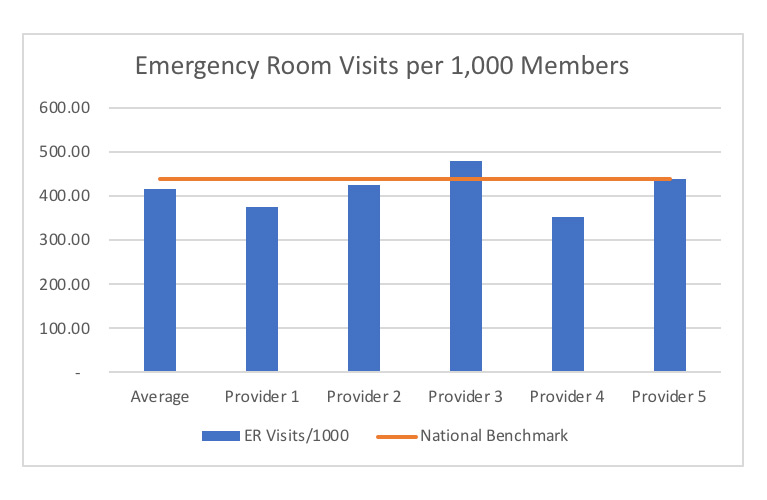
As you can see in this graph, this market is already performing below the national benchmark on average. However, there are a few providers who are doing significantly better, which highlights an opportunity to improve ER utilization even further. Provider 3 has the highest ER usage of all the attributed populations; whereas Provider 4 has lowest utilization rate. With further research, we can identify what processes are in place with Provider 4 that we may be able to spread across the entire market.
Case Study 2
There may be times a benchmark will be used as an achievable target based on internal data.
In this case study you are trying to determine what is an achievable target for average length of stay for a specific APR-DRG during an inpatient admission to your covered hospitals. Your consultant has a national benchmark for ideal length of stay, but the hospitals disagree with the benchmark since we are only focused on pediatric cases. You want to compare with what’s happening in the market. Currently there are five hospitals that are covered in your network. You first need to calculate the average length of stay for the selected APR-DRG at each of these hospitals. This is illustrated below in graph 2.
During our analysis, it is found that the best in class average length of stay for this APR-DRG is just under 3 days per admission; with the longest average stay length being above 6 days per admission. When calculating your average length of stay and comparing hospitals it is important to account for known differences between the hospitals. Examples of these differences include severity and demographics; since we are using APR-DRG severity is already included and since we are focusing on a pediatric population we do not need any additional adjustments for demographics. Also, it is important to check the utilization count for each hospital, in this case bed days per 1,000 members, to ensure the data is credible and not skewed by low utilization counts. In reviewing graph 2 below we find that an average length of stay of 3.0 days per inpatient stay is a realistic target as hospital 5 is already performing at that benchmark and has high enough utilization to be considered a credible target. This also lets us know that hospital 4 should be the first to be reviewed as they are performing with the longest average length of stay while also having high enough utilization to be credible.
Graph 2

Once a relevant length of stay benchmark has been established we can proceed into additional analysis. For example, this benchmark can be used to develop case rates to reimburse hospitals, decide which hospitals to keep in your network, or which hospital to target with medical management review.
Closing Remarks
These case studies provide simplified examples of how you can proceed with meaningful and actionable analysis when a standardized benchmark is either unavailable or inappropriate to use.
Benchmarks are a very useful tool for deciphering analytics – in particular, identifying top areas of opportunity. Deciding which type of benchmark to use requires a deeper understanding of what you’re trying to measure with the benchmark. There will be times that looking at a national, industry, or statewide benchmark is the most appropriate. There will be times creating your own benchmarks, as shown in the case studies we reviewed earlier, will be more informative than comparisons to standard benchmarks. It is important to be informed either way.
About the Author

Zachary Westphal, ASA, MAAA is an Actuary at Axene Health Partners, LLC and is based in AHP’s Temecula, CA office.