
In California, the DMHC and DOI facilitate a transparent and accessible means to look up rates and rating information for plans in the individual and small group market. However, gathering a market-encompassing view of the plan designs corresponding to those rates is more elusive. Although the Federal actuarial value (AV) provides some indication of the benefit value and richness, any given AV can correspond to a variety of plan designs. AHP has developed a proprietary tool using sophisticated software which can efficiently extract all plan design information and store it in a database, where Summary of Benefits & Coverage (SBC) are available. We can easily map this data to the corresponding rate filings to create a unique and all-encompassing perspective of entire markets and regions. The ability to compare across both rating and plan design information provides valuable insights for strategic planning and trend identification. We call it the Market Blueprint ToolTM and this article provides a sample of how it can summarize the individual and small group markets in CA.
The ability to compare across both rating and plan design information provides valuable insights for strategic planning and trend identification.
Individual Market Summary
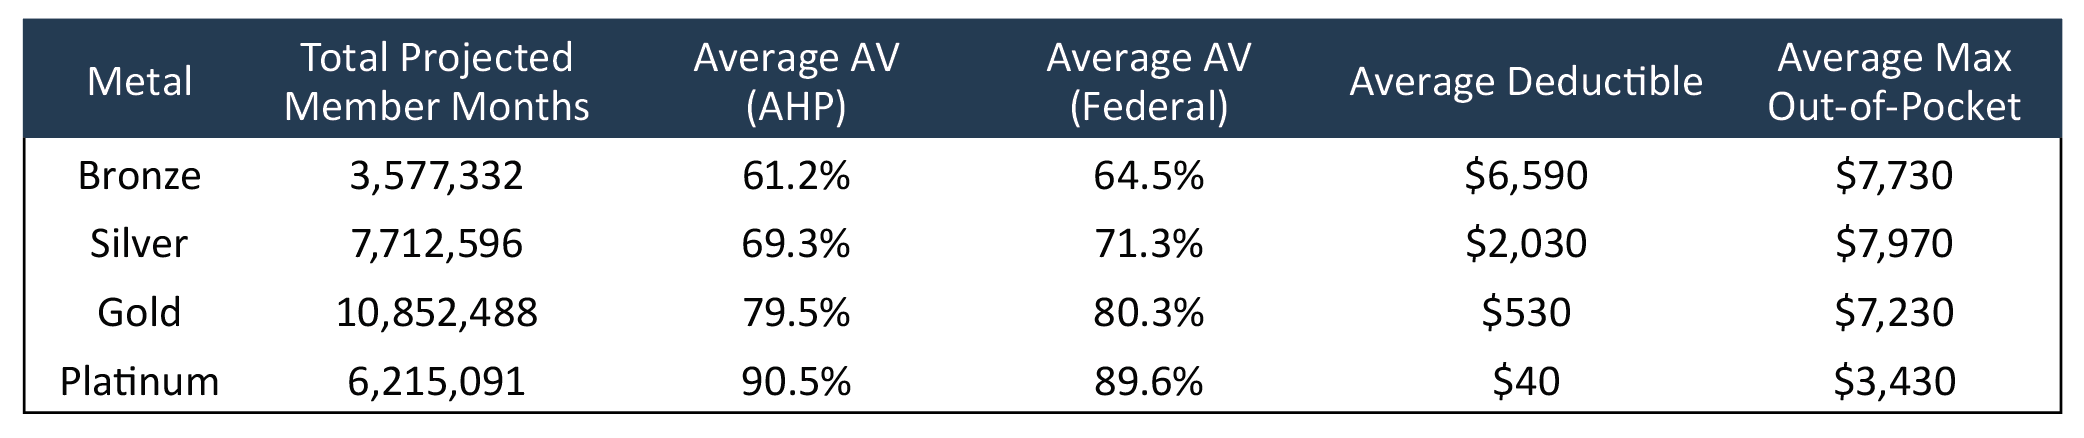
The CA individual market comprises nearly 318 million member months with over 75% of those member months from on-exchange plans. In addition to the federal actuarial value provided in the rate filings, we calculated the actuarial value using the AHP proprietary AV tool. Table-1 below shows the total projected member months, actuarial value (AHP & Federal), average deductible, and average max out-of-pocket for each metal tier.
Table-1: Individual Market Summary

This table shows an understandable degree of variation between the AHP and Federal AV due to modeling differences. However, this becomes significantly pronounced for exchange-only plans in the silver tier. The average silver AHP AV is nearly 5% higher than the average Federal AV on the exchange, while this difference is less than 3% for all other tiers. Any plan design offered on the CA exchange is subject to specific requirements. By mandating copay-dominant plans, Covered California can provide richer benefits to their members while still staying within required ranges of the Federal AV (which tends to under-value copay plans, but that contention is beyond the scope of this article).
Small Group Market Summary
According to rate filings, the CA small group market is comprised of over 28-million-member months, most of which are off-exchange (SHOP). Table-2 is a summary table of the small group.
Table-2: Small Group Market Summary
The average AHP AV and Federal AV are much more aligned in the small group market than the individual market. Furthermore, most of the member months come from gold plans (38%), followed by silver and platinum (27% and 22% respectively). This contrasts with the individual market where 49% of member months are in silver and 35% in bronze. Only 16% of the individual market is in gold and platinum. The projected member months in rate filings provide a proxy for plan popularity and can be used to make valuable comparisons within a market segment.
Individual vs Small Group Plan Designs
Comparing summary statistics of the plan designs reveals some interesting differences between the individual and small group. Chart-1 shows the average deductible and max out-of-pocket for each market and metal tier.
Chart-1: Average Deductible and Max Out-of-Pocket

The most notable difference for the average plan is the deductible for silver and gold plans. While individual plans offer a higher silver deductible by approximately $1,500, they have a lower average gold deductible by $550. Furthermore, the max out-of-pocket is relatively similar between individual and small group plans in bronze and silver tiers; however, the gold and platinum small group plans have a lower MOOP by approximately $1,000. In addition to comparing averages, Chart-2 shows the range of MOOP by market and tier. An important observation when comparing Chart-1 and Chart-2 is that the MOOP range has more variation across metal tiers than the MOOP average, particularly among bronze, silver, and gold plans. Although there may be some plans with lower MOOPs available, most are clustered near the upper end of the range.
Chart-2: Range of Max Out-of-Pocket

Small group has a much wider range of MOOP in the platinum and gold tiers. It is not surprising that the prescribed designs for on-exchange individual plans yield less variability. However, the individual market offers a plan with a very low MOOP for the silver tier. The silver plan with a $4,250 MOOP is off-exchange and functions as an HDHP. The next lowest MOOP for individual silver plans is $6,850 which is more aligned with the small group market.
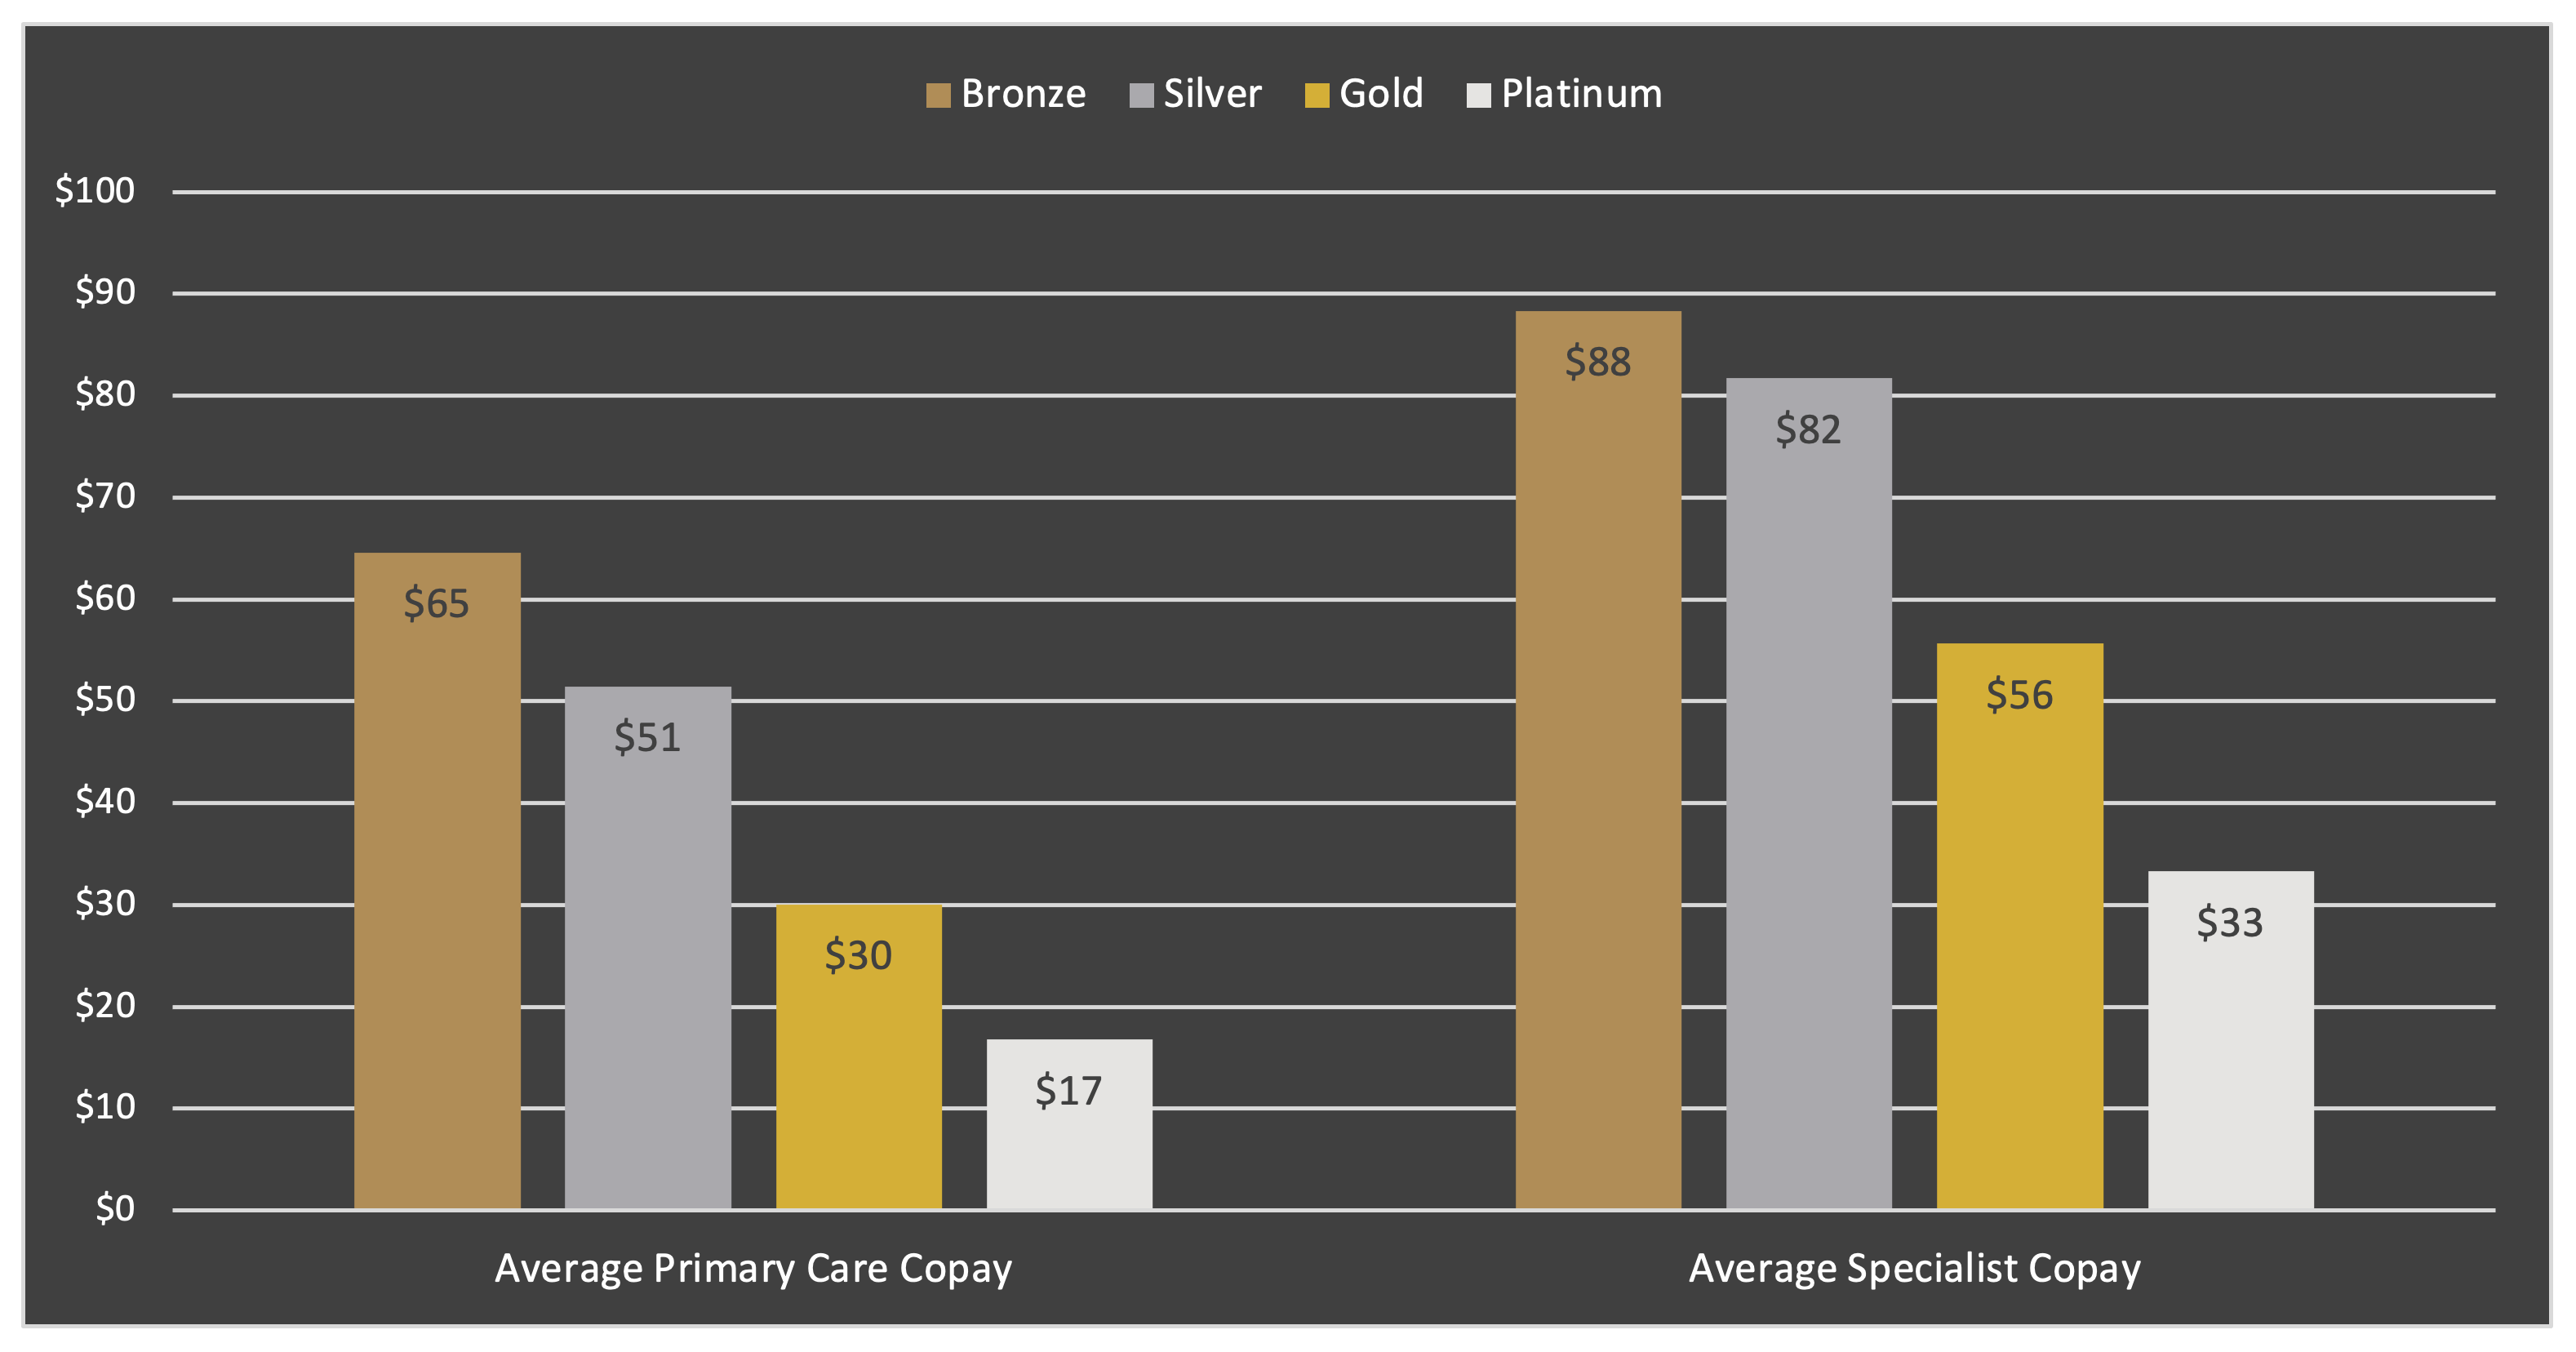
Chart-3 and Chart-4 show the average copays for primary care and specialist office visits. Chart-3 is for the individual market and Chart-4 represents small group plans.
Chart-3: Individual Market Average Copays

The trends seen in these graphs reflect the expected decrease in copay amount as the metal tier increases. High deductible health plans and coinsurance plans have been removed to provide accurate comparisons. In the individual market, there is minimal difference between the silver and gold primary care copays and large decreases when jumping to platinum plans. On the other hand, the small group market reflects a more gradual decrease in copays as plan richness increases.
Chart-4: Small Group Market Average Copays
Strategic Planning
Health plans and exchanges can benefit from the AHP Market Blueprint ToolTM in their strategic planning process to identify areas of opportunity in the market. Health plans can compare their offering to other plans in their region, assess popularity of different plans, and formulate a plan design with attractive features to their members. Exchanges can use the tool to compare their offering to off-exchange plans and identify any discrepancies. This tool can be easily extended beyond California to other regions in the United States. Users hold a blueprint of their entire market which proves valuable to a variety of healthcare stakeholders.
About the Author

Any views or opinions presented in this article are solely those of the author and do not necessarily represent those of the company. AHP accepts no liability for the content of this article, or for the consequences of any actions taken on the basis of the information provided unless that information is subsequently confirmed in writing.