
Patients with multiple chronic diseases constitute a small minority of the total population but the majority of healthcare costs. These patient’s healthcare needs cannot be understood simply as the sum of each disease they have because chronic diseases interact with each other, increasing the prevalence and severity of different but related disease states. Therefore, understanding the relationships between diseases is critical in managing patient care.
One technique for understanding these relationships is to use claims data history to understand the co-occurrence of diseases in patients. Axene Health Partners leveraged the MarketScan Commercial Claims database to construct an analysis of disease inter-correlation. A patient profile was constructed for each member in the database that characterized the diagnoses present in 2021 claims for that patient. Each diagnosis a patient had was categorized into a diagnosis-pair, so for example, an individual with ICD-10_CM codes of I10 (primary hypertension), K21.0 (Gastro-esophageal reflux disease with esophagitis), and M79.0 (rheumatism, unspecified) has three diagnosis-pairs (I10/K21, I10/M79, K21/M79). Over 950 thousand disease interactions were identified.
“Axene Health Partners leveraged the MarketScan Commercial Claims database to construct an analysis of disease inter-correlation.”
Several co-occurrence metrics were then calculated for each diagnosis pair. Several potential measures exist, including relative risk, Russell-Rao similarity, Pearson coefficient, Pointwise Mutual Information, and Yule Q. While all metrics organize each diagnosis-pair from most-common to least-common, the metrics differ in terms of the relative weight they give to outlier observations. Russell-Rao similarity was chosen for this analysis because it balanced outlier observations best.
The final dataset was then illustrated using network graph techniques. In a network graph, the distance between two points and the width of the line connecting the points illustrate the strength of the relationship between those points.
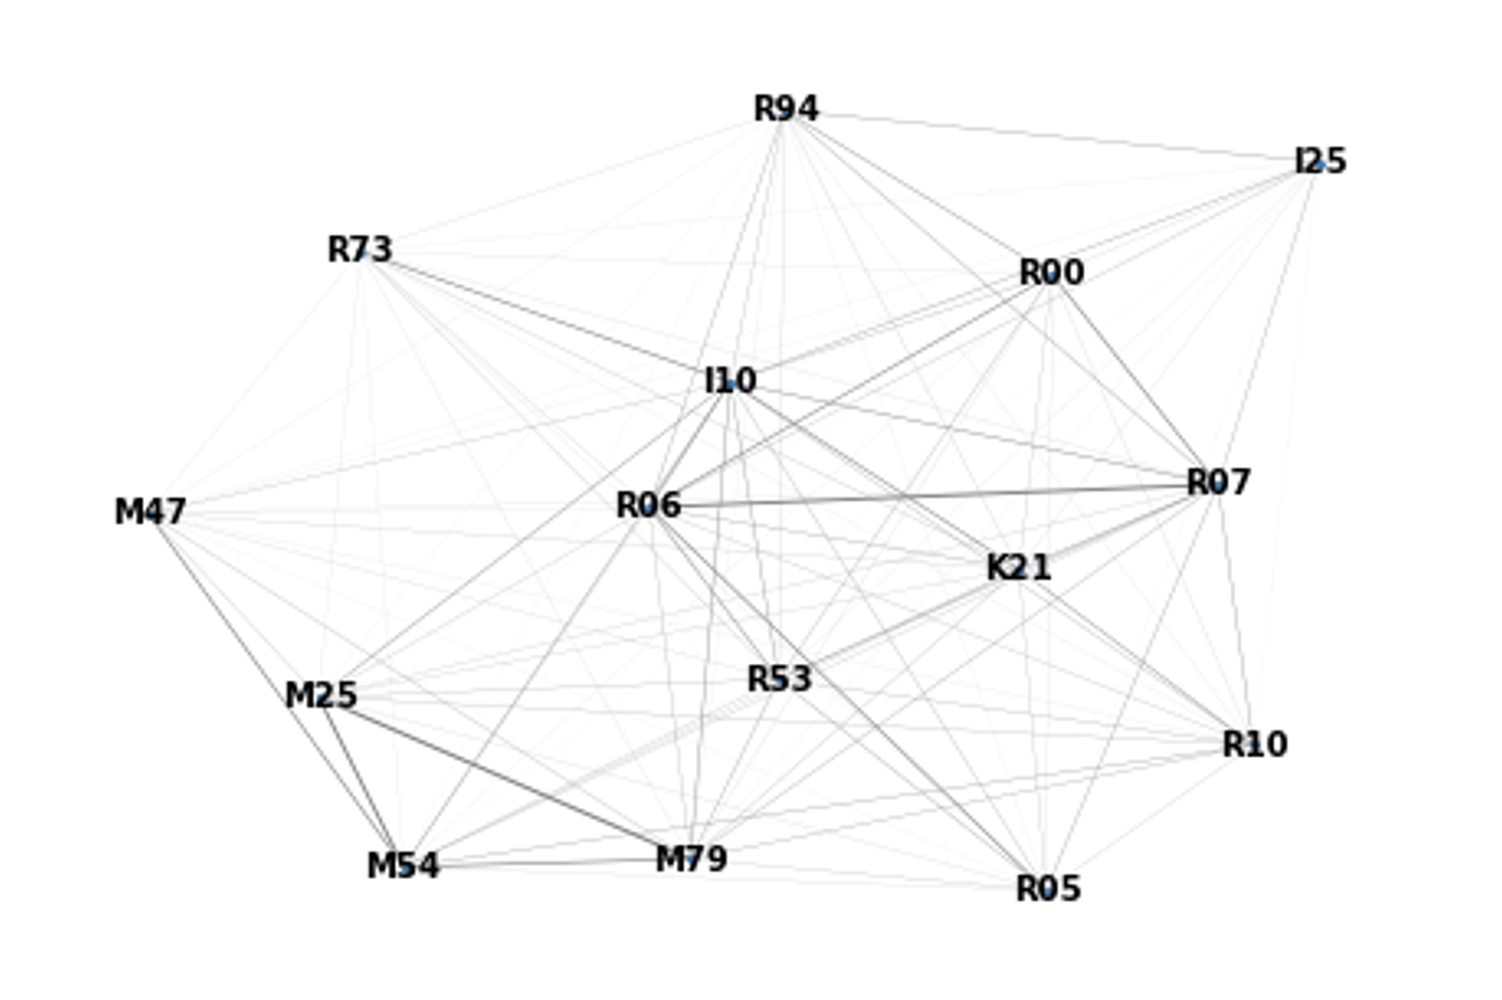
The graph below shows the co-occurrence relationship between the 15 most commonly co-occurring data points and diagnosis I10 (primary hypertension). Focusing on the I10 node, we can see the boldest lines. Coming out from it are R73 (Elevated blood glucose level), K21 (GERD), and M54 (Dorsalgia, i.e., spine/back pain). Focusing on the lower-left corner of the graph, we see many codes in the “M” family, which is for musculoskeletal and connective tissue conditions) grouped, and a strong co-relationship between them. Similarly, the “R” signs and symptoms codes have strong relationships with each other.
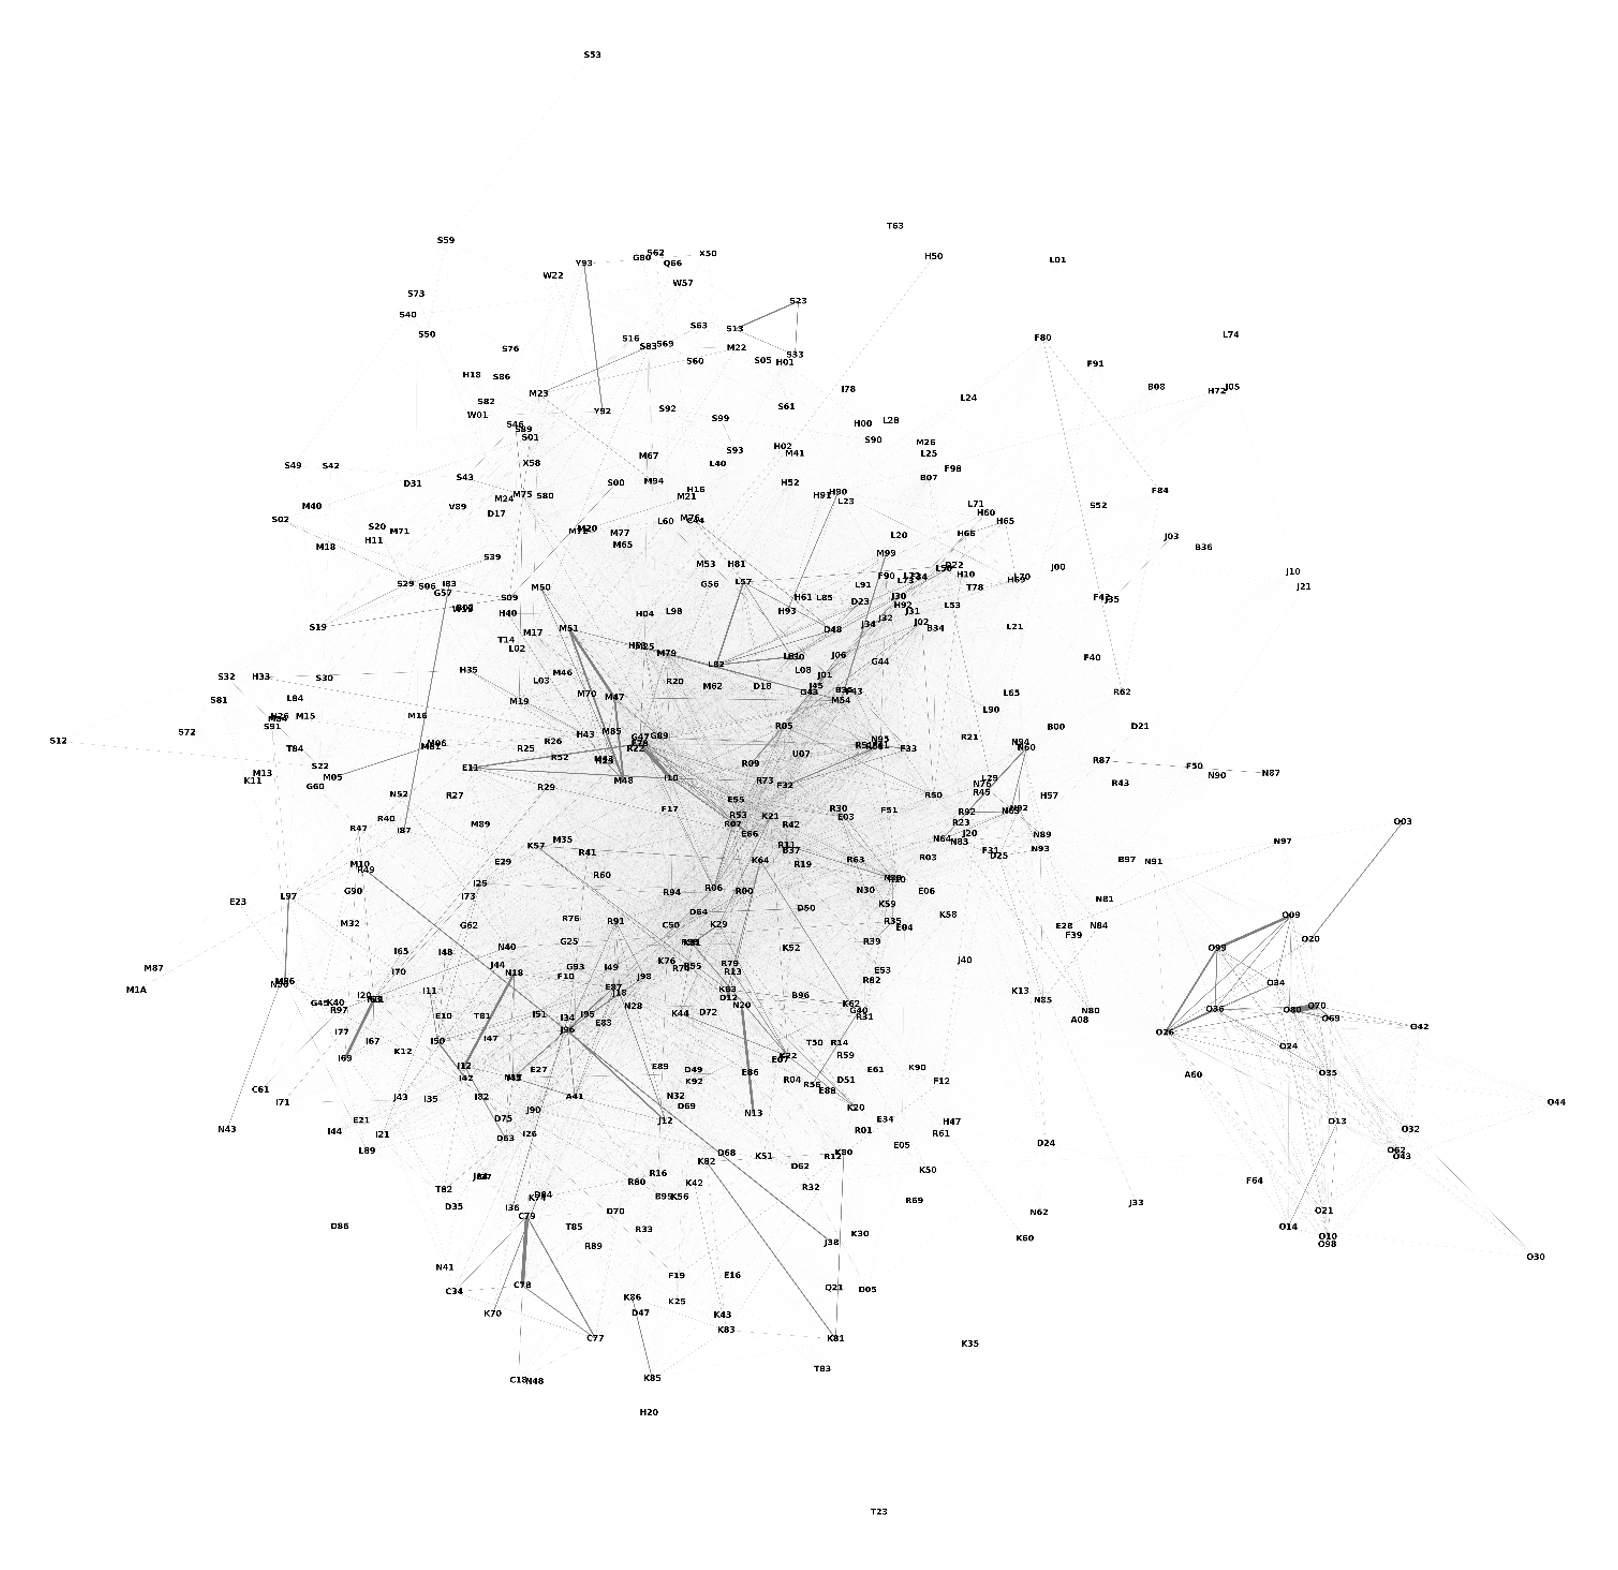
The figure below depicts the co-occurrence among the top 500 most commonly occurring diagnoses. In addition to being able to assess relationships between individual diagnoses, we now see that groups of diagnoses are forming.
In the bottom right of the graph, the “O” codes (used for maternity/) and N80 – N98 range (noninflammatory disorders of the female genital tract) form a close group. Musculoskeletal conditions in the “S” and “M” families are grouped along the right edge of the graph.
The middle clump of diagnoses has the most common conditions across all co-occurring diagnoses, namely the “R” codes describing signs and symptoms (e.g., R05 – acute cough, R73 – elevated blood glucose, R19 – digestive conditions such as diarrhea, heartburn, or vomiting).
The center of the graph also contains lifestyle disease conditions like I10 – primary hypertension, F17 – nicotine dependence, and E78 – hypercholesterolemia, which are significant contributors to other conditions.
The most distant diagnoses are those related to accidents or rare diseases and are unrelated to any diagnosis: M92 – juvenile osteochondrosis; S53 – dislocation and sprain of the elbow; T23 – burn and corrosion of wrist and hand.
There are several potential uses for a framework like this:
- Disease Management – understanding the co-occurrence of diagnoses can assist in a holistic approach to disease management, prioritizing proactive disease management treatments to prevent co-occurring diagnoses that are not already present and understanding underlying causes of disease that may not be the primary diagnosis.
- Diagnosis Prospecting – diagnosis code-based risk adjustment programs rely on accurate and complete diagnosis coding. This framework could be used to identify potentially missing and auditing diagnosis codes.
- Payment Integrity – ICD-10-CM codes are used in reimbursement for many Inpatient services through DRG payment and for auditing clinical appropriateness for pharmacological and other treatments. Understanding diagnosis code co-occurrence could be a tool in auditing claims.
About the Author

Any views or opinions presented in this article are solely those of the author and do not necessarily represent those of the company. AHP accepts no liability for the content of this article, or for the consequences of any actions taken on the basis of the information provided unless that information is subsequently confirmed in writing.