
I once saw a billboard advertising a new insurance product co-branded by the local hospital system and a large national insurance carrier. The promise was 8-15% in premium savings.
That makes sense, I thought, especially with the small print clarifying that the discount was in comparison to the insurance carrier’s “broad network” offerings in the region. Significant savings are often needed to entice the potential customer away from the broad networks they have become used to.
But how does the product achieve this premium savings, and additionally, does the math work for both sides of this dual-branded partnership, or ACO (Accountable Care Organization)?
Perhaps you are considering or have already begun a partnership like this. Your motivation may have been your hospital system’s desire to “dip their toes in the water” of accepting risk, without taking the full plunge into the deep end of full-capitation or creating an insurance entity. Your motivation may also have been a desire to do the right thing, or put differently, you are already investing heavily in reducing unnecessary utilization such as readmissions, and are interested in finding a way to capture some of this value versus giving it all to insurance companies.
This document will give you not only the basics of how a premium is constructed, but also a deeper understanding of the various levers of premium savings, and how they could impact your bottom line if your future or current deals are not structured correctly. As a provider, when deciding whether or not to take on more risk, I always say, “the devil is in the details”.
One final detail, this article is built around an assumption of the development of a commercial product, perhaps one that will be offered on the federal marketplace created through the ACA (Affordable Care Act). With that said, many of the levers discussed would apply to an ACO being developed in other lines of business such as Medicare Advantage or Managed Medicaid.
Insurance Pricing 101 – For Hospital System Executives
Having been an actuary supporting both insurance carriers as well as the provider community, I have learned that some very simple mathematical exercises continue to surprise (and sometimes depress) executives on both sides of the ACO partnership. This comes from seeing how little savings is often achieved from what are seen as somewhat aggressive actions.
Exhibit 1 below shows the various levers that you might employ in identifying premium savings. At the highest-level, to achieve cost savings and lower the premium, you need to perform less care, make the current care cheaper, or both. Put even more simply, the buildup of medical cost driving the health care premium dollar considers the average number of “widgets” of provider services and the price of each “widget”, in some period of time covered by the premium payment.
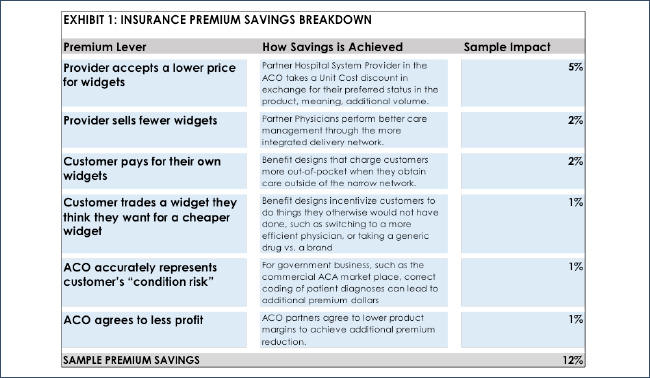
But there are more than these two levers behind the lowering of premium. Other factors could include getting the health insurance customer to pay for some of the widgets out of their own pocket, or agree to exchange certain desirable widgets for less desirable widgets through either positive reinforcement (“carrots”) or negative (“sticks”). Finally, the ACO partners could work together to achieve higher premiums or even agree to lower their expected profit margins on the ACO product.
As one would expect, hospital-systems are certainly weary of both less widgets and lower priced widgets. And health insurance customers do not particularly like paying for their own widgets or being told which widgets to buy and where. And finally, insurance companies including ACOs have a need to make a profit. In a nutshell, it is very difficult to squeeze 8-15% savings out of a health insurance product.
But it can be done. The sample premium impact on Exhibit 1 shows that we could indeed achieve the level of savings promised in the advertisement. Let’s now look at these potential levers that a health plan or ACO can “pull” to squeeze savings out of their new product offering.
The Hospital System Discount: Preferred Pricing in Exchange for Volume
Let’s say you are a hospital-system CFO or Managed Care executive, and one of the insurance carriers in your market offers you the chance to be the “Preferred Hospital System” in a narrow network product. All that is required is a discount from your current broad network rates. You are told: “the volume will come pouring in, the profits at the end will be shared equally, and everyone in the partnership will be happy”. Remember, the devil is in the details.
First, let’s look at the premium impact of lowering unit cost. Consider this: there is a lot more spend in the total cost of care than just hospital spend. It takes a lot more than a 5% discount to achieve a 5% premium savings on an insurance product – almost 4 times more, actually. That revelation is often a surprise to both provider-side executives as well as insurance executives.
To illustrate why this is, let’s look at a $400 sample commercial monthly premium for an individual customer outlined in Exhibit 2.
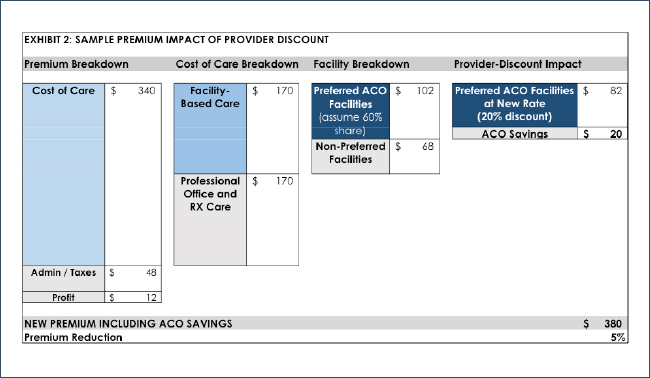
The first column breaks down the premium into the cost of care, administration and taxes, and profit. In this product (such as one for the federal exchange), we set a typical 85% of the premium to go towards the cost of care. If 12% of the premium goes towards admin and taxes, this leaves 3% towards profit to be shared. (This illustration assumes the product was priced properly.)
The second column further breaks down the cost of care into facility based care (hospitals, surgery centers, skilled nursing facilities, etc.) vs. professional care, including physicians, other medical providers (home health, medical supplies, etc.) and retail pharmacy spend. While this division in cost varies depending on the reimbursement level of hospitals in each region, it typically falls very close to 50/50 for a commercial (non-Medicare, non-Medicaid) market.
The third column demonstrates that while the preferred hospital partner in the partner product is going to receive the most volume, they are certainly not going to receive all of it. This exhibit assumes 60%, which is a reasonable target in a competitive hospital environment. Besides market preference and willingness to pay the out-of-network (OON) fees, the three biggest factors driving volume to non-preferred facilities include emergency care, alternative sites of care (skilled nursing, surgery centers, etc.) and members that live outside of the hospital service area.
The final column applies the 20% discount to the partner provider rates, and shows the resulting impact on the original $400 premium. Total savings: 5.1%.
Note that this is a simple illustration, and a more thorough model would need to consider the relative reimbursement of the competing hospitals in the region. Recall that a goal of this product is to move volume to your system. If your system has lower relative reimbursement to your competitors, a product the pushes more volume to your system would achieve additional cost savings. And conversely, if your system has higher relative reimbursement, the new product would result in higher costs.
Let’s now discuss the volume aspect of the deal in more detail. We say above that the preferred provider discount is in exchange for volume, but how much volume is actually achieved? Always remember, if your system is “winning” volume, some other system is “losing” volume. You must consider the way your hospital competition will react, perhaps even by developing their own narrow-network partner product or ACO.
Consider the following product outcomes as far as volume, based on whether your hospital system exists in a competitive hospital market or if you are the dominant or sole system:
• Competitive hospital market. Your competitor learns of your new narrow-network product and decides to create one of their own. Assume that in the end, both products are equally successful: you pick up some of your competitor’s patients and they pick up some of yours. The result, all volumes stay neutral, and your margins and your competitor’s margins will both drop because of the discounts taken.
• Non-competitive hospital market. You realize that you are already getting the majority of the volume in your market so little additional volume is able to be achieved. You decide to move forward, regardless, to learn about taking risk or because it is the “right thing to do”. Assume that customers are buying the product in large numbers because they still get to use the system they love and now at a discounted premium. The result: Your margins drop due to the discount in rates for the product.
So, with these discount and volume considerations in mind, how can the math work to create a profitable product? Key factors that lead to profitability:
• Product success – If customers love your product, you will be able to price the product so that adequate margins are achieved and there is plenty to share between both partners.
• Improved efficiency – If you are able to reduce administrative costs through the ACO, for example moving care management into the physician practice to better manage chronic conditions (or at least perform better diagnosis coding on the members – more on this later), these savings can significantly increase the margins of the product.
• Reducing utilization in areas that do not impact your system – Reducing volume or costs in places that do not touch the system’s bottom line, perhaps in areas like retail pharmacy drugs, medical supplies, home health services or skilled-nursing facilities, will fall back to the system in the shared profits of the ACO product.
Let’s continue to look at the additional savings levers which help to achieve the necessary premium reduction.
Improved Care Management: For everyone, or only for the ACO product?
Referring back to Exhibit 1, Premium Impact, we see the sample 2% savings from improved care management. When assisting with the development of various value-based reimbursement arrangements, I find that models often land on a 2% savings assumption, achieved through lower utilization. I often think these levels are set without truly understanding the significant effort it takes to achieve that level of savings through improved care management. There are several “devils” in the details related to this 2% estimate.
First, the care management that is being modeled in the financials implies that there is better care management being performed on patients in the ACO product than all other patients. This often makes physicians and hospital executives uncomfortable when discussed, but recall the billboard and the premise of the ACO product: An 8-15% discount vs. the carrier’s broad network rates. So, better care management processes need to be in place for the ACO member than the member carrying a broad network insurance card. Many hospitals promote the “same care for all members”, so this pushes the need for care management savings to be driven by an improvement in processes and work flow, often tied to the integration of technology. This essentially means that only ACO members would be included in care management tools, analytics and process flows.
Second, achieving the 2% premium differential is typically more difficult than each doctor needing to improve the care of their patient panel by 2%. Why? Because ACOs are not typically designed in the “Kaiser model”, meaning, there are usually a large number of physicians in the product who are outside of the partner system. If the partner physicians are only touching, let’s say, half of the members in the product, and care management programs have not been put in place at the other physician practices, partner physicians would need to achieve up to double the utilization savings, or 4%, in order to achieve the overall target. Getting all members in the ACO product engaged is an area that many ACOs and technology vendors are working to address, but a lot of progress is still needed to properly motivate non-partner physicians.
Finally, better care management actually costs more money, because additional resources are often needed, including nurses, care coordinators and data analysts. If these expenses are incremental, they need to be factored into the equation.
So, if care management is not fully implemented within the ACO, how can the math work around this necessary utilization savings? In actuality, the narrow-network ACO product often does achieve more than a 2% drop in utilization. However, the utilization reduction achieved may not be due to improved care management, but rather due to a term Actuaries call “selection”. In the case of a narrow network, in which the customer is being told they cannot go to certain hospitals or providers, those that do not think they will need significant amounts of care tend to buy the lower-priced product. Over an average population, their combined self-predictions of lower utilization will often be correct, and lower utilization will be achieved by the narrow network product.
In closing out this section, true care management improvements are often the most questionable in terms of actual positive financial results. Certainly there is often realized improvements in quality, which is great news for patients, but the focus of this article is on financial savings. There is still a great deal of opportunity to achieve significant efficiencies in the delivery of care across much of the country.
Customer Driven Actions
The next pricing levers all have to do with getting insurance customers to do things that they perhaps do not want to do. These benefit design levers have their roots in the HMO models of the 1980’s. Many of us working in that era recall that customers (and the media, and Hollywood, even) learned to not like the idea of being told what to do in relation to their health care. But we also know that even today customers are looking to save money on their insurance premiums. So as a result, we continue to incorporate these benefit designs into our insurance products, just in a way that is more digestible to customers.
The first lever, out-of-network (OON) and/or tiered-cost sharing, can lead to significant savings; however, the savings are out of the wallet of your customer. If the customer decides to go to an OON or non-preferred hospital, hopefully knowingly, they can pay a significant portion (up to the entire amount in a strict HMO) of the cost out of their pocket. This “savings” will ultimately lead to profits that can be shared by the partners in the product, however, this could bring significant financial hardship to the customer if they get balance-billed by an OON hospital.
An important variable that needs to be considered here is how your state regulates OON leakage for emergency care, including emergent admissions. If a market is not regulated to protect the insurer or ACO against OON prices (a worst-case example being a requirement to pay billed charges which can be set as much as 1,200% of Medicare), it could make a narrow-network product unviable due to the potential high-cost of these OON claims. Fortunately, many states as well as the ACA are beginning to address these “balance billing” practices for insurance entities looking to create narrow-network products, capping the amount a non-participating hospital can receive at a reasonable level.
The second lever, encouraging the patient to achieve efficient care through modifying the benefit design, lowers member cost to encourage positive actions (“carrots”), and increases the cost share to discourage the use of higher cost services that provide little or no incremental value to similar lower cost services (“sticks”). A positive example is value-based benefit design, in which a patient with a chronic condition like diabetes is provided certain medications with little or no cost-sharing to ensure that they do not stop taking a critical medication which keeps them out of the hospital. Another could be lower or free copays if the member switches from their less efficient primary-care physician to one within the ACO. A good example of increasing cost share to encourage member behavior would be a strict drug formulary, which encourages customers to take preferred brand or generic medications that lead to cost savings without sacrificing the health of the patient.
The list of opportunities that encourage customers to get the best care at the best price is plentiful. I find the difficulty is two-fold: 1) making these often complicated benefit designs easy for the consumer to understand, and, 2) balancing the fact that some of these levers push care away from the preferred hospital entity, for example, the use of surgical centers, imaging centers and independent labs vs. the preferred hospital.
Finally, since this article is about pricing, while very technical, I must mention that the creation of metal levels within the ACA gives insurers a lot less flexibility in how much they are able to modify benefit designs, because of the need to stay within the metal level. This is why it is important to balance out the benefit levers by incorporating both those that are “carrots” (less cost share) and “sticks” (more cost share).
Higher-Premium or Lower Margin on the Product
In truth, many of the advertised stories on successful ACOs and risk partnerships (especially in the Medicare Advantage space) have been based on the revenue side of the equation, meaning, improved risk scores for members leading to a significant increase in premium revenue from their competitors in the market. Risk adjustments within the federal healthcare exchanges were set-up as a zero-sum game, meaning carriers with lower risk would provide payments to carriers with relatively higher risk, if their premiums do not accurately reflect a similar change in risk. Accurate coding of members in the ACO product helps to ensure that your competitors do not get some of your premium through more accurate coding of their members. And significant revenue can be gained if you learn to code significantly better through the improved performance of the ACO.
The last lever I will mention is reducing the expected margin on the product. While this is not an option desired by either party in the partnership, there may be pressure to lower the price in order to make the product more desirable, at least in the initial years. This may especially be true if the provider partner is most concerned about receiving additional volume, and the insurance partner is most concerned about maintaining market share.
The Math of the Deal: An ACO Financial Model from the Hospital Perspective
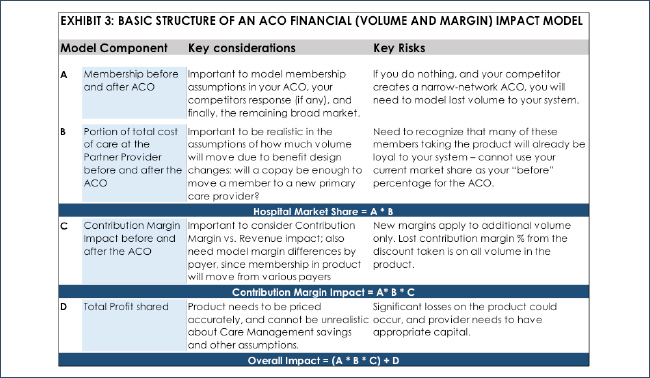
In assessing the math of the ACO product, it is very important to develop the model correctly, with all of the necessary components and formulas. Exhibit 3 below shows a high level view of the components of a successful ACO financial model.
As you design and develop a financial model to assess your ACO, it is important to consider numerous scenarios based on the levers that I describe above. Consider volume. What if you expect your hospital system’s market share to increase from 40% to 60% in the product, and in reality you only achieve 50%? Or what if the members who actually buy your product were already using your system 55% of the time to begin with, and they move to 60%? These volume assumptions are critical in understanding the success of the ACO product. Also critical is realizing that this potential new volume to your system will increase your variable costs, of course, and thus a need to consider the contribution margin impact to your system and not just revenue.
It is very important to assess the accuracy of your model as soon as you begin receiving the actual claims experience upon implementation of the product in the market. This could occur as soon as 3 to 4 months after the start of the product, to allow time for some claims runout to occur. It will allow you to test many of the assumptions that you modeled in your initial scenarios.
You may want to consider hiring an outside Actuary to review your model for accuracy, completeness, and testing various scenarios for the many model levers. Some actuarial firms, like AHP, already have models developed that can be customized for the specific nuances of your product. This may be a more economical solution for your health system. And often, even more important than having a good model is having an expert that has learned over many years of developing models and then watching various deals work or not work. Remember, the devil is in the details with these partnerships, and having experience on your side could mean the difference between success and failure.
Summary – Is it worth it to create these partnerships?
Despite the leanings in this article towards the difficulty and complications of creating successful ACOs, I wholeheartedly believe that the provider community will play a much bigger part on the risk-side of the health care equation in the future, and learning how to accept risk and understand insurance premiums is a critical skill to learn. It makes too much sense that once patients in the market are divided into various preferred systems, and the market stabilizes to a point where pricing is more predictable, that the preferred system will say, “I want those insurance margins for myself”. But remember my final list of “devil in the details”:
• Hospital margins and insurance margins will continue to be squeezed through competition and regulation, so it is important to continue to improve efficiency and reduce costs within the system.
• Care management and utilization management will ultimately have to improve: While it makes more sense for providers to be performing care management (I always ask, who are you more likely to call back regarding a new program for your chronic condition – your physician, or insurance company?), overall outcomes need to be proven. As far as utilization management, insurance companies have been playing the “bad-guy” for years, and have gotten quite good at it, and ACO’s will need to learn this skill.
• Become “as Kaiser as possible”: This should include the complete integration of ACO products within the EMR (electronic medical record) system so that differentiation for the product can occur automatically, and true care management (including getting patients into the most efficient care possible) can be achieved.
• Actuaries will be a part of your future, if they are not already. It is important that your organization has a better understanding of risk, so that you prepared for the “what-if’s” of the various scenarios you are considering. A good Actuary will walk you through that process, allowing you to select various scenarios, and help you understand the range of outcomes that will likely occur.
Any views or opinions presented in this article are solely those of the author and do not necessarily represent those of the company. AHP accepts no liability for the content of this article, or for the consequences of any actions taken on the basis of the information provided unless that information is subsequently confirmed in writing.
About the Author
