
Any views or opinions presented in this article are solely those of the author and do not necessarily represent those of the company. AHP accepts no liability for the content of this article, or for the consequences of any actions taken on the basis of the information provided unless that information is subsequently confirmed in writing.
Introduction
Aligning capitation rates with the line of business and risk selection of attributed members is an important component of provider contracting. Furthermore, doing so can illuminate hidden dynamics in financial reporting and help influence provider behavior under value-based contracting. The implication of not doing so is that lines of business attracting lower risk will not receive lower capitation rates and will unintentionally subsidize other lines of business that generally attract members with higher risk. This especially impacts Affordable Care Act (ACA) lines of business as the CMS-run risk adjustment process pays back the risk selection in full. However, provider contracting can be sensitive and often starts with the legacy contracts already in effect, perhaps entailing reticence to accepting risk-adjusted capitation rates.
This article will briefly discuss potential types of approaches to risk adjusting the capitation rates, advantages and disadvantages of select approaches, examples of how the process may function and other considerations in implementing a new contractual arrangement with the providers. This document is meant to foster potential ideas and is not intended to reflect a comprehensive list or specific recommendations. More in-depth analysis, including a review of the Division of Financial Responsibility (DOFR) and existing capitation agreements, is needed to determine the best approach.
“Choosing a successful approach requires balancing the goal of aligning selection risk with costs and achieving provider buy-in and acceptance of the approach.”
Potential Approaches
Choosing a successful approach requires balancing the goal of aligning selection risk with costs and achieving provider buy-in and acceptance of the approach. Three main types of approaches that could be considered are listed and described below:
- Non-Revenue Neutral Approach – This approach develops risk-adjusted capitation rates based on the relative risk of a provider’s population compared to a defined standardized population representing 1.000 or average risk. Capitation rates would be adjusted prospectively based upon a retrospective calculation of relative risk to the assumed standard or average population. Providers who have historically been assigned a lower-than-average risk would likely receive decreased revenue and vice versa for those serving a higher-than-average risk. Payments would reflect the actual relative risk of patients attributed to the provider which will likely also differ by various lines of business.
- Advantages: More accurately aligns risk and cost which will best align financial performance and risk selection between providers and various lines of business.
- Disadvantages: Likely a non-starter for providers as many will receive reduced prospective compensation. This approach would be ideal if implemented at the start of the program but is difficult to implement after a baseline revenue pattern has been established without risk adjustment.
- Retrospective Revenue Neutral, Prospective Risk Adjustment – This approach would establish a baseline average risk of 1.000 for each provider based on their own current average risk. The first-year reconciliation would be revenue neutral but would reallocate PMPM capitation rates by the line of business matching relative risk. Future changes in risk scores by lines of business will adjust future capitation rates by the line of business and the total baseline for the provider. This approach will not preserve revenue neutrality for future years but rather establishes a revenue neutral baseline based on the provider’s current risk mix.
- Advantages: Revenue neutral approach may be acceptable to providers. Better aligns costs and risk, reducing subsidization between lines of business. Allows for a baseline to be set where future improvements in risk or an increase in enrollment will be captured as savings.
- Disadvantages: Future years could increase risk and there may be up-coding from providers which would result in higher costs. Providers that had already attracted better risk, lock in that advantage which maintains disparities between providers. For experience-based products (Large Group), increased costs may result in larger than expected rate increases for current accounts.
- Retrospective and Prospective Revenue Neutral – This approach would reallocate capitation rates between lines of business for each provider but would maintain revenue neutrality for future years. The provider’s total average risk is set to 1.000 and each line of business is reallocated capitation rates in relation to the total average risk. Changes in year-over-year risk scores would not change provider revenue. Each year is considered in isolation and the reallocation is strictly seen at the line of business level. This approach functions more as an accounting approach to better align financial results with risk selection.
- Advantages: Revenue neutrality is maintained in future years which may be even more acceptable to providers than setting a baseline in year 1. Results reflect more of an “accounting shift” between lines of business as opposed to implementing risk adjustment.
- Disadvantages: Inadequately accounts for future changes in risk or risk disparities between providers. For experience-based products, increased costs may result in larger than expected rate increases for current accounts.
The second major consideration is determining what metric to use for the risk adjustment process. While there could be a variety of metrics, this document will discuss two potential metrics.
- Age-Adjusted Concurrent Risk Scores – Analysis can be performed on a calendar year basis after sufficient run-out to calculate the average risk by the line of business and provider. Resettlements can be reported and paid and prospective adjustments to PMPM capitation rates can be made using the line of business adjustments. Year-over-year calculations may be transparent and easy to understand.
- Advantages: Providers are familiar with these risk scores as they are already part of the risk sharing arrangements. Risk scores reflect the best estimates of changes in expected costs.
- Disadvantages: May be viewed as volatile year over year, especially with smaller populations.
- CMS Risk Transfer Payments – ACA risk transfers allocated by attributed members can be used to base adjustments to the capitation rates. A variety of metrics may be used. The relative market risk can be used (provider Risk Transfer Payments[1]/Statewide Average Premium), relative revenue can be used (provider Risk Transfer Payments/provider Revenue[2]) or relative cost of health care could be used (provider Risk Transfer Payments/provider Total Cost of Health Care). These ratios can be calculated for each provider and each line of business and used to adjust capitation rates or set relativities between providers and lines of business.
- Advantages: May help in explaining the theoretical need of risk adjusting the capitation rates to the provider because the CMS risk transfers reflect actual amounts paid or received from CMS depending on the risk. It may be seen as an objective third-party metric that is directly connected with financial performance. This will only impact individual market (Ind) and Small Group (SG) lines of business, so experience-based rates on large accounts in the Large Group (LG) can be left unchanged.
- Disadvantages: The risk transfer payments reflect items like CMS premium factors and statewide average premiums, so risk is not always directly captured in the number. There is a lag in timing as the payments are not finalized until the summer of the next year. Lastly, since it doesn’t account for LG, this metric would minimize the ability to properly align cost and risk.
Examples of Risk Adjusting the Capitation Rates
We are providing two conceptual examples of approaching risk adjusting the capitation rates. These examples are meant to illustrate concepts for consideration and are not concrete recommendations. The examples do not reflect actual average costs or risk across the lines of business. The first example represents a Retrospective Revenue Neutral, Prospective Risk Adjustment approach using Age Adjusted, Concurrent risk scores as the metric for risk adjusting. The second example shows a Retrospective and Prospective Neutral approach with CMS Risk Transfer Payments. The following steps outline these potential approaches.
“A financial metric report like the high-level one shown below can be developed for each provider that establishes a baseline average risk for each line of business.”
Example #1: Retrospective Revenue Neutral, Prospective Risk Adjustment with Concurrent Risk Scores
Step 1 – Using a base year or years, develop line of business adjustments that reflect relative risk and are calibrated to be revenue neutral. A financial metric report like the high-level one shown below can be developed for each provider that establishes a baseline average risk for each line of business.
Table 1: Prospective LOB Adjustment Development
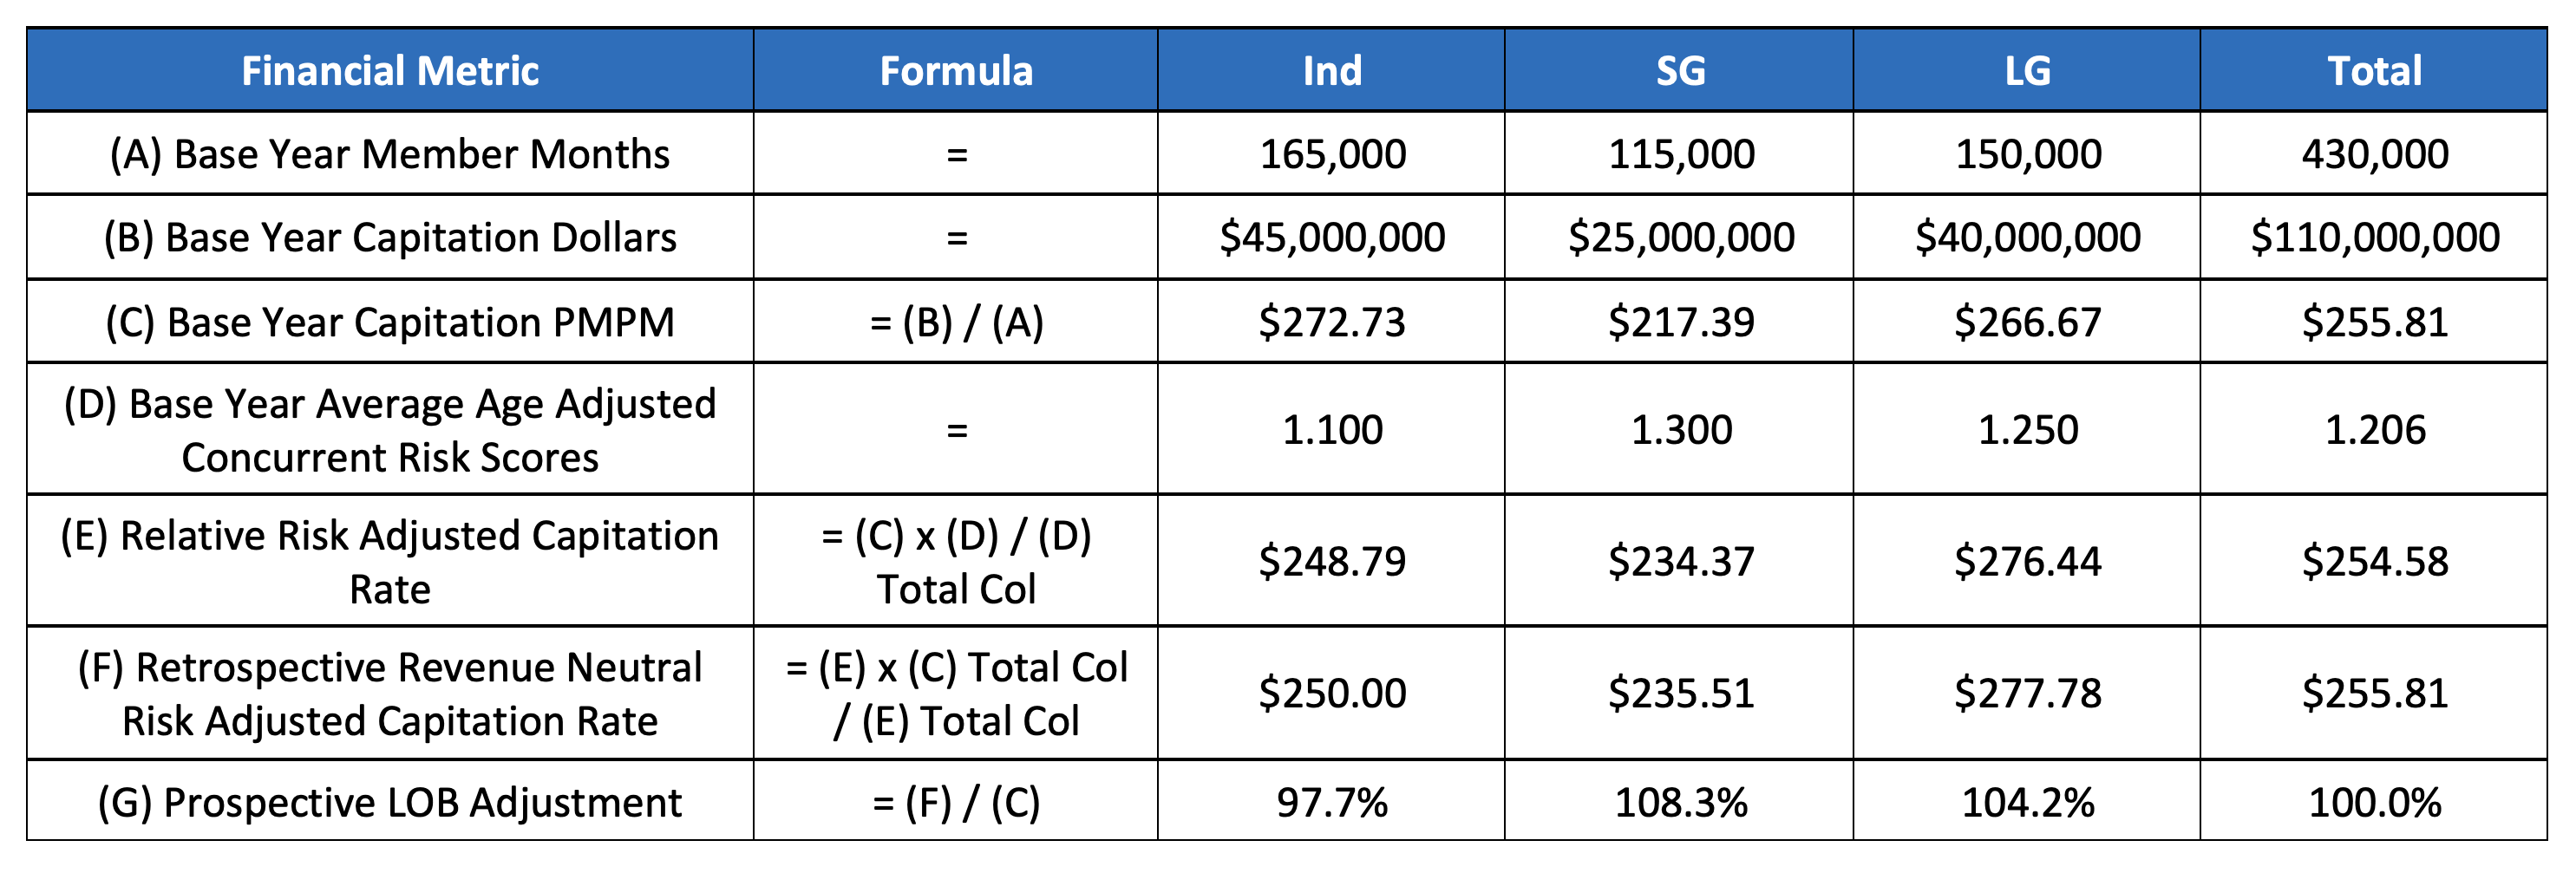
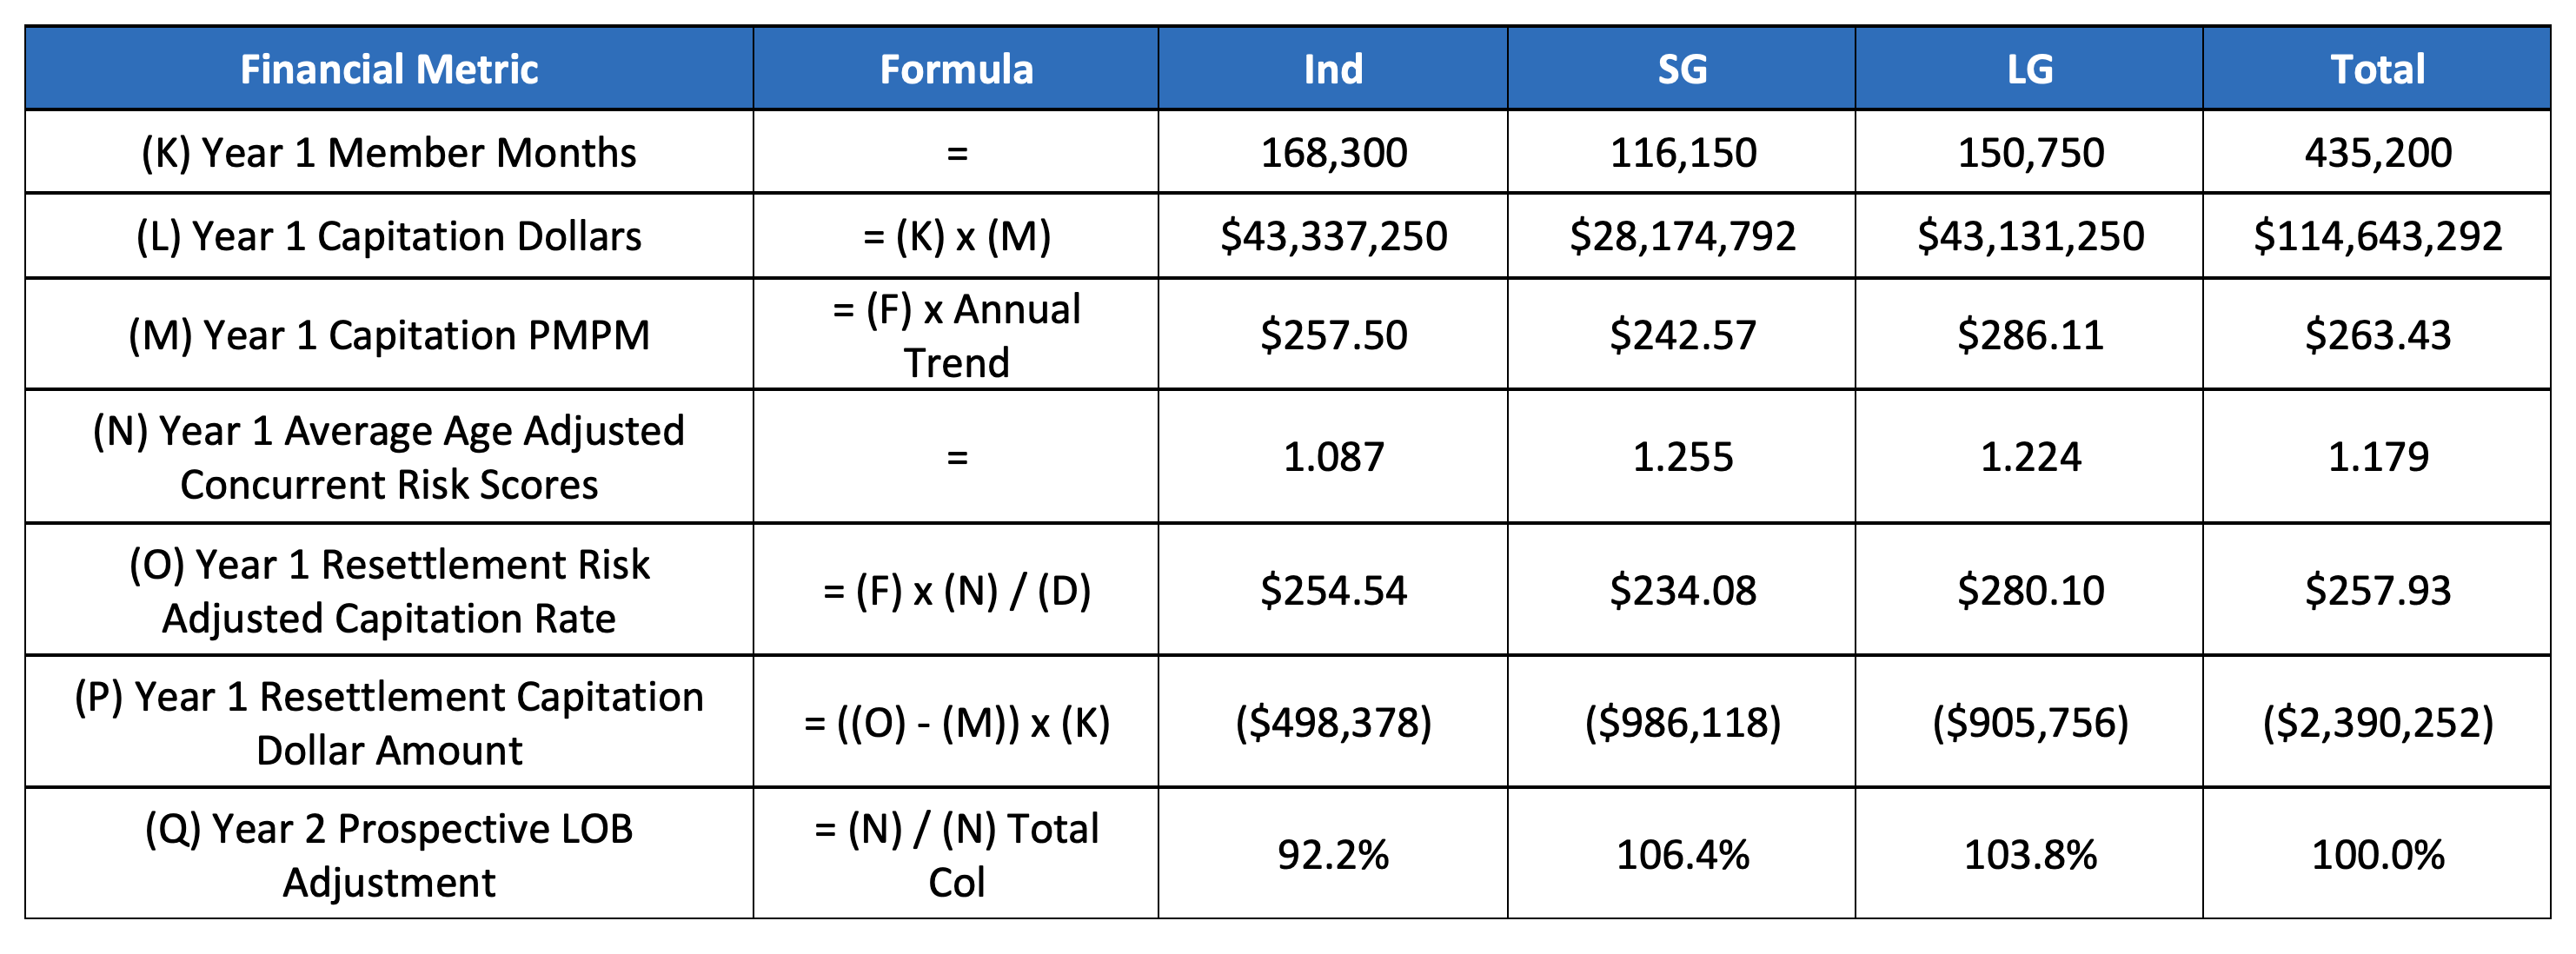
Step 2 – Year 1 capitation rates will reflect the total adjustments shown in Table 1. At the end of year 1, new risk scores will be available to adjust each line of business (LOB), creating both a resettlement amount and new LOB adjustments for the following year. The example shows what would happen if there was an across-the-board improvement in risk.
Table 2: Year 1 Results and Year 2 Prospective LOB Adjustment
Example #2: Retrospective and Prospective Neutral with CMS Risk Transfer Payments
This example demonstrates an approach that serves more as an accounting adjustment that maintains revenue neutrality for the providers and the insurer; however, capitation is reallocated to reflect the risk adjustment payments paid/received from CMS. Row E shows that on average 4% of the total cost of health care was received in risk adjustment payments between Ind and SG markets. SG paid 8% of its total cost of health care whereas Ind received 15%. Each of the risk transfer payments or receivables by lines of business is compared to the overall 4% average.
Table 3: Retrospective and Prospective Neutral with CMS Risk Transfer Payments
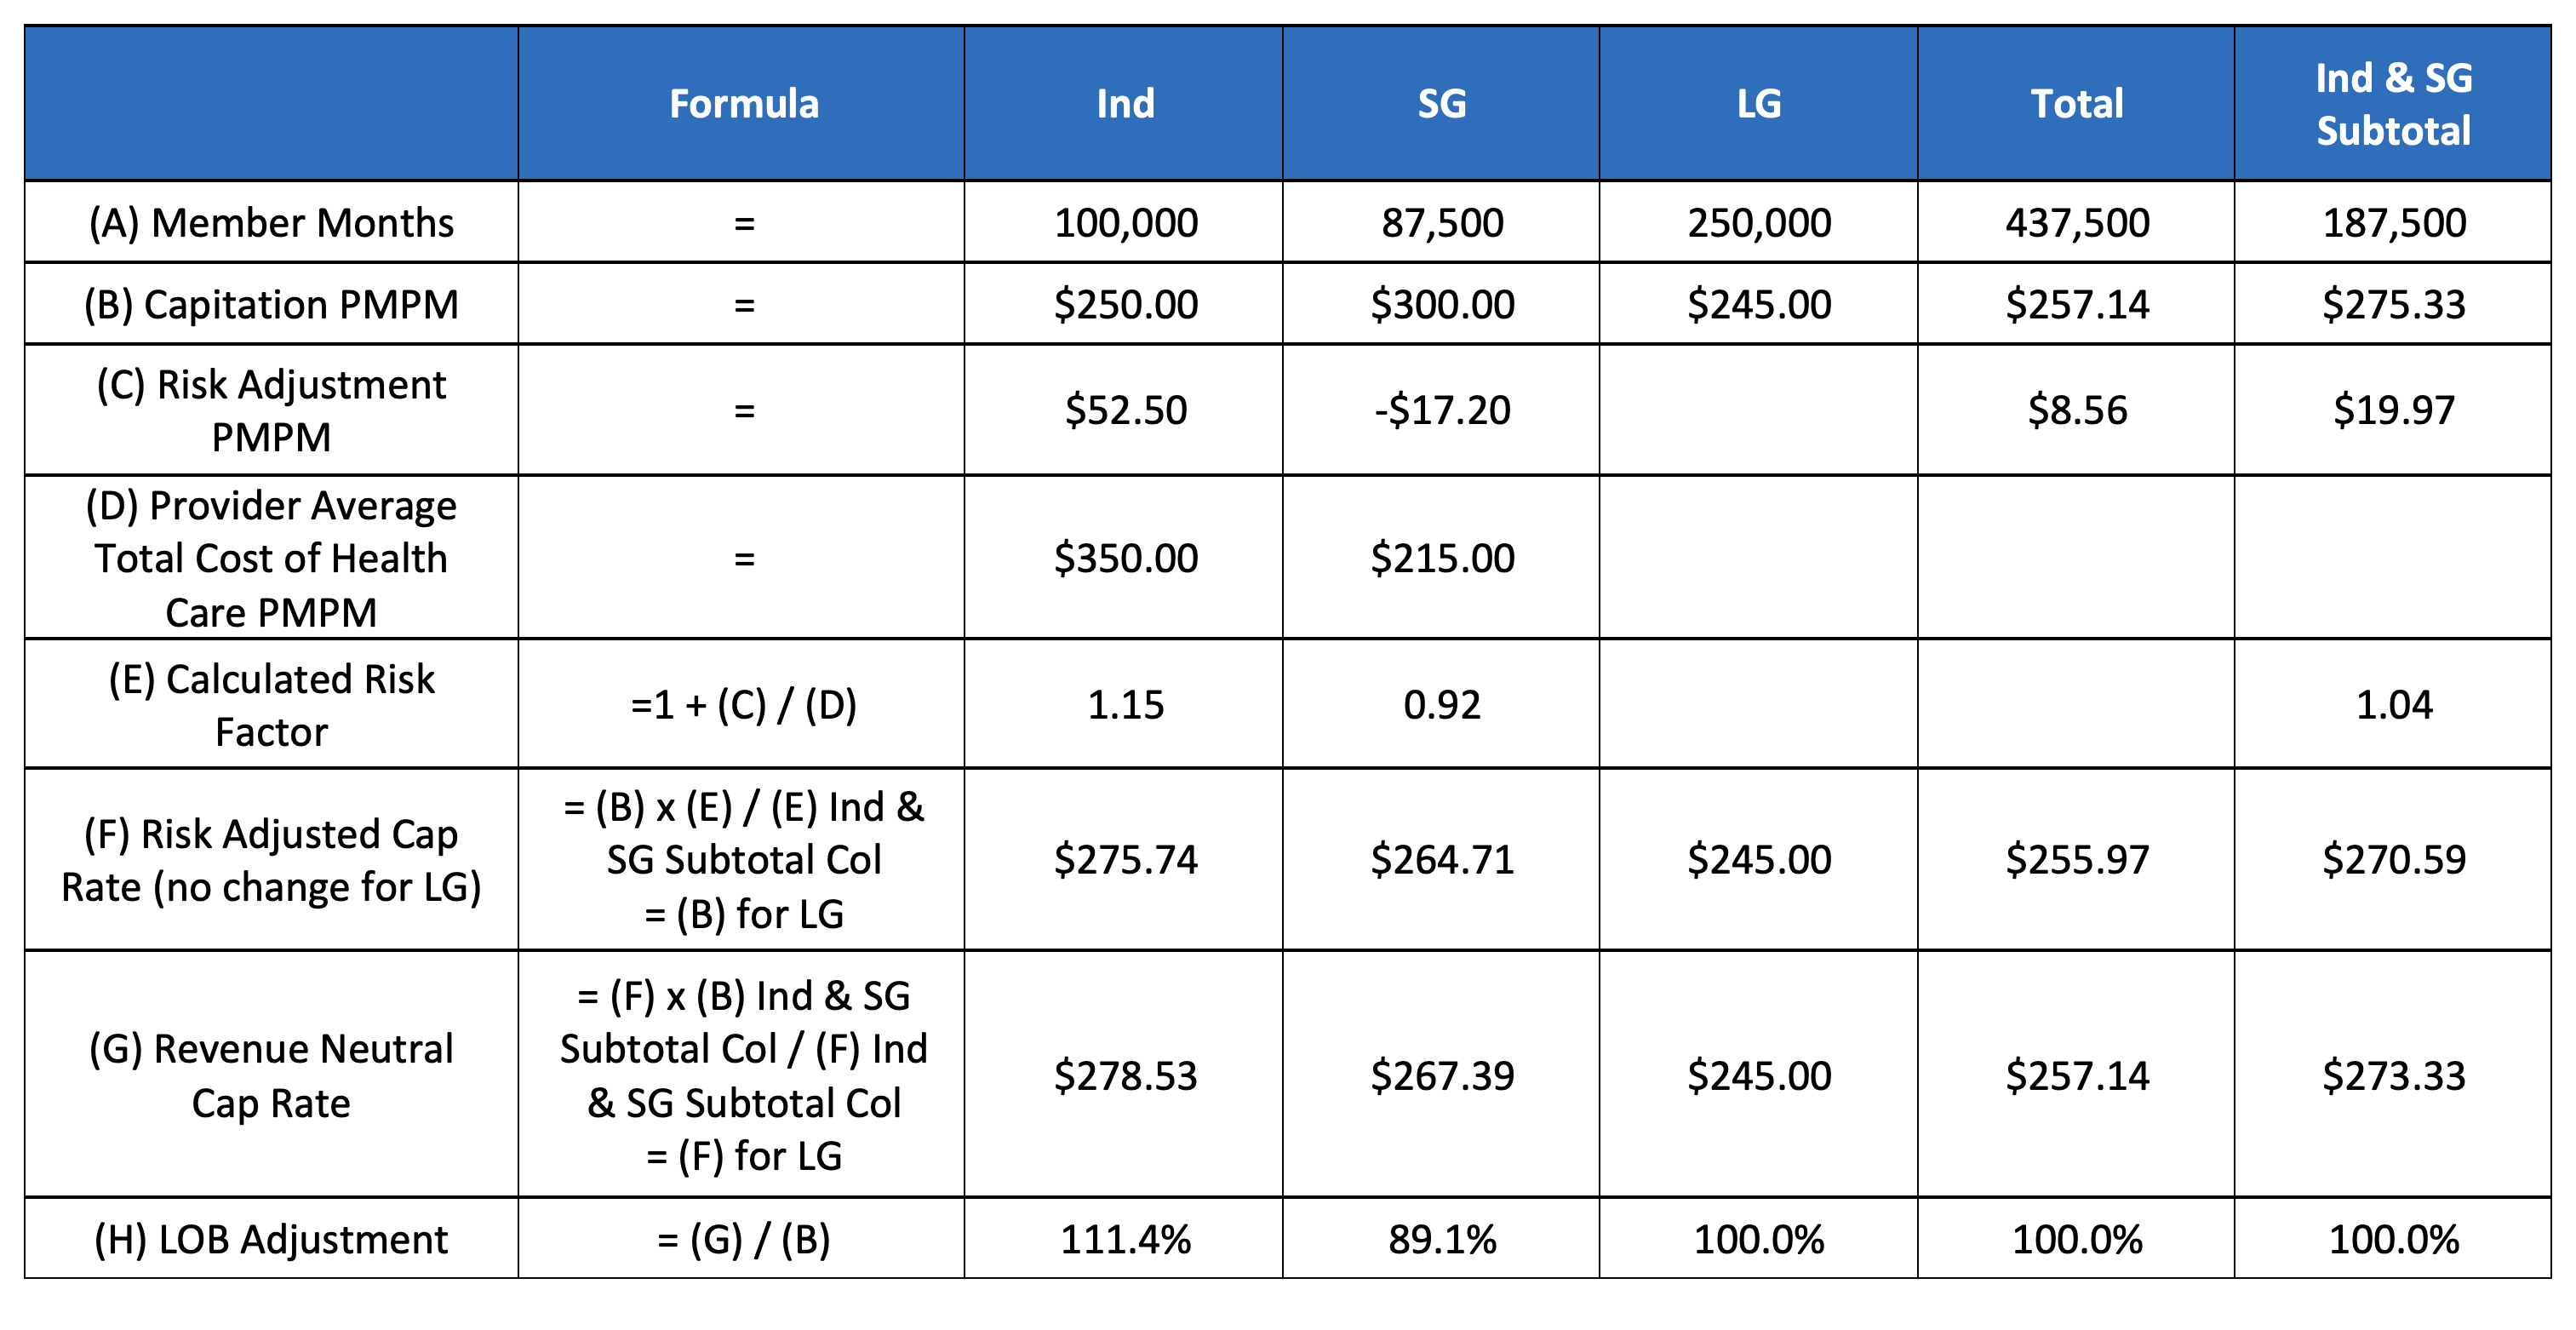
The calculations are very similar to Step 1 from the previous example and are repeated annually once risk adjustment is paid/received. Capitation amounts for large group remain unchanged. However, the individual and small group risk adjustment payments are used to derive risk scores and reallocate their capitation amount to account for relative risk. Ultimately, this provides a more accurate accounting of profit margins among the lines of business but does not change the revenue overall.
“When implementing a risk adjustment factor to the current capitation contracts, it is critical to understand how it will impact the providers, consumers and lines of business.”
Further Considerations
When implementing a risk adjustment factor to the current capitation contracts, it is critical to understand how it will impact the providers, consumers and lines of business. From the provider’s perspective, revenue neutrality may be the most palatable approach but communicating that risk adjustment improves the alignment of actual risk, payments and resources needed may also be understandable. This understanding may vary between providers and should be conveyed in the context of any additional adjustments.
The community rated blocks of business (Ind and SG) can see improvements in financial performance because after premiums are set this adjustment might lower the cost of health care. However, large group accounts receive renewal rates based on their own experience. Premiums are not “set” for some large groups so increasing the cost of health care will increase renewal premiums for some large employers. Conversely, premium renewal rates will improve. This may create a more marketable product in the large group market at the risk of losing some members.
Change in health status is the most important variable to capture in the risk adjustment process. However, several other factors are worth considering. Dramatic changes in the provider’s number or type of participating providers could influence its ability to manage care. Furthermore, the geographic dispersion of members is pertinent even if the average health status remains unchanged. In addition to varying amongst providers, these factors may change year-over-year for each provider and warrant an adjustment to the capitated amount.
Endnotes
[1] Based on attributed members.
[2] Total premium revenue of attributed members.
About the Author

