
Any views or opinions presented in this article are solely those of the author and do not necessarily represent those of the company. AHP accepts no liability for the content of this article, or for the consequences of any actions taken on the basis of the information provided unless that information is subsequently confirmed in writing.
Introduction
Actuaries are called upon by the healthcare industry to develop assumptions, factors, formulae, etc., that are used by underwriters to determine premium rates for health insurance benefit plans. Determining premium rates for multiples benefit plans often requires the use of benefit relativity factors (i.e., the relative cost from one benefit plan to another), which are traditionally modeled using benefit relatively models, or actuarial value (i.e., AV) calculators. Benefit plans have evolved to the point where they are too complicated to have their relative costs modeled appropriately using AV calculators. It is the opinion of the author that a new type of tool, often referred to as a Claims Adjudication Model, will be the tool that is relied upon in the future to model benefit relativity factors. This paper will provide an overview of AV calculators, the ways in which benefit plans have changed, why changing benefit plans have made AV calculators obsolete. This paper will also provide an introduction to Claims Adjudication Models with an emphasis on why they are better suited to handle more complex benefit plans.
Overview of Benefit Relativities
Benefit relativity factors are used to calculate differences in costs between benefit plans. These factors are a function of plan specific member cost sharing, network, area, and coverage limits. They are often shown as plan specific paid-to-allowed (i.e., P/A) ratios, which are a measure of the percentage of the allowed claims cost PMPM for which the carrier is financially responsible.
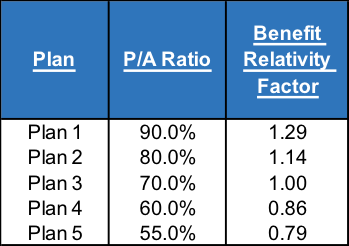
The table above shows P/A ratios as well as benefit relativity factors for five plans. The user of the benefit relativity tool calculates the P/A ratio for each plan, picks an anchor plan, and then calculates benefit relativity factors for the remaining plans as a function of the anchor plan. In this example, Plan 3 is the anchor plan, and the benefit relativity factor for Plan 1 is 1.29 (or 90%/70%).
AV calculators are developed by many practitioners ranging from actuarial departments at insurance companies for their own internal uses, to commercially available models created by actuarial consulting firms, to the Federal AV Calculator used by all carriers filing Individual and Small Group ACA plans to test compliance with AV metal levels, etc.
Overview of AV Calculator Models
Although no two AV calculators are identical, they all share similar characteristics:
- Several inputs are required, such as:
- Plan specific member cost sharing features,
- Demographic information of the covered population,
- Provider contracting discounts, and
- Health care cost trend.
- Healthcare services are displayed as mutually exclusive benefit categories that have multiple levels (or hierarchies). A typical hierarchy would include medical vs Rx as the least granular benefit category level. Medical would then typically be subdivided into inpatient, outpatient, and professional. Inpatient, for example, would then be subdivided into medical stays, surgical stays, maternity, etc. These benefit categories are then used in the Actuarial Cost Model (i.e., ACM) to the calculate member cost share PMPM when the member cost share is in the form of copayments.
- Order of operations – For each benefit category, an allowed claims cost PMPM is estimated, a member cost share PMPM is calculated, and then a paid claims cost PMPM is determined as the difference between the allowed claims cost PMPM and the member cost sharing PMPM. Afterwards, the P/A ratio is calculated as the ratio of the paid claims cost PMPM to the allowed claims cost PMPM for all benefit categories.
- Claims probability distributions (i.e., CPDs) are used to calculate member cost share PMPMs when member cost sharing is in the form of deductibles, coinsurance, as well as out-of-pocket limits.
- Adjustments for area, member demographics, induced utilization, etc., are used to calibrate the allowed claims cost PMPMs to the population being modeled.
The Evolution of Benefit Plans
Over time benefit plans have increased in complexity to the point where the valuation of these plans using traditional AV calculators has become burdensome and often unreliable. Three reasons for the increase in the complexity of benefit plans include:
- Value based insurance design (i.e., VBID) – VBID is an approach to product development where the member pays less for high value services, and conversely, the member pays more for low value services. High value services are defined as services which improve the member’s health outcome while at the same time being less expensive than alternative services. Examples of high value services include doctors’ visits and medications for chronic conditions (e.g., diabetes, COPD, asthma, etc.), services performed by providers that the insurance company deems as efficient (i.e., high quality and low cost), etc. The net result of VBID is an increase in the complexity of plan designs.
- Affordable Care Act (i.e., ACA)
- a) One of the requirements for a benefit plan to be approved for sale in the Individual and Small Group ACA marketplaces is that the benefit plan’s AV must fall within one of the metal level ranges. As a result of claims cost leveraging, insurers are often required to make minor changes to specific member cost sharing features each year to keep the benefit plan within one of the metal level ranges. These minor changes often result in added complexity of the plan design.
- b) Complex plan designs were not as prevalent prior to the implementation of the ACA because carriers had greater ability to underwrite and risk rate policyholders to meet their profit targets. However, since the ACA’s rating rules enforced community rating and guaranteed issue, many carriers offered more complex plan designs as part of a strategy to help meet their financial goals.
- Cost containment and competitive pressures – In order to lessen the impact of premium rate actions, carriers have turned to shifting more of the claims cost onto members in the form of increased member cost sharing. A new plan design feature is created by one carrier, and then as a result of responding to the competition, that new plan design feature (or some variation of it) is copied by all other carriers. These new plan design features are often very innovative, which leads to added plan design complexity.
The following are a few (of potentially endless) examples of the types of member cost sharing features that are becoming more common and stretch the capabilities of traditional AV calculators.
- Plans for which certain services have annual limits on the number of units covered.
- Plans for which inpatient benefits have a per diem copayment for a specified number of days per admission.
- Plans for which office visit benefits require the member to pay a copay for each visit up to an annual limit, and then for each additional visit after the limit, the member switches from paying copays to paying deductible/coinsurance.
- Plans with drug benefits that use copays or coinsurance depending on the allowed cost per script.
- Plans with cost sharing provisions for service categories more numerous than the service categories represented in the AV calculator. This is an issue that is common with plans that incorporate VBID.
Carriers are typically left with three options when encountering benefit plans that are too complex to model appropriately in their AV calculators:
- ignore some of the detail in the benefit plans as being relatively unimpactful,
- perform side calculations to map a benefit plan to a simpler, but hopefully equivalent design, or
- modify the existing AV calculator to accommodate the additional benefit plan complexity.
The first two solutions are workable in fairly simple situations, but are not a long-term solution to the increasing complexity of benefit plans. The last solution requires the assignment of a significant amount of resources to engage in potentially un-ending and highly complex updates to the organization’s AV calculator. Such an effort also creates communication problems as users need to be informed about the changing capabilities of the organization’s AV calculator and potential issues with the calculation of differing benefit plan values by AV calculator version.
Overview of Claims Adjudication Models
Claims Adjudication Models provide a viable solution to the issues that arise when using traditional AV calculators to model increasingly complex benefit plans. Claims Adjudication Models do not use ACMs, nor do they use CPDs to calculate benefit plan relativity factors. Instead, they replicate the process of claim adjudication done by an insurer’s claims payment system. The big advantage of Claims Adjudication Models over AV calculators is that they are more flexible in terms of accounting for more complex benefit plan provisions.
Claims Adjudication Models
Claims Adjudication Models can be built in spreadsheets, relational databases, or non-spreadsheet based programming languages such as R or Python. Spreadsheets are considered a good tool because the majority of AV calculator users are intimately familiar with them. However, spreadsheets have file size as well as calculation speed limitations. Claims Adjudication Models built outside of a spreadsheet are capable of handling the large datasets inherently necessary for accurate claims adjudication, and they also tend to be powerful enough to handle large calculations quickly. However, users may not be familiar with non-spreadsheet environments and languages which would typically be used to build and utilize the models.
The following are some general guidelines for the development of Claims Adjudication Models:
- Data requirements – The underlying data is the heart of the Claims Adjudication Model, and therefore, is the very first item in this list of guidelines. Two datasets are needed: a claims dataset, and an eligibility dataset. The eligibility dataset contains detailed information about the members, such as subscriber and member IDs, member relationship codes, date of birth, gender, zip code, industry, etc. The claims dataset contains detailed information about the claims associated with the members in the eligibility dataset, such as claim number, claim line number, date of service, health care service type, allowed amount, units, etc. It is very important that the data is checked (and rechecked) for accuracy, reasonableness, and consistency. Additionally, a data dictionary describing the datasets, data fields, and data variables should be developed to allow for efficient use and update of the Claims Adjudication Model.
- Cohort selection – The next step is to select the appropriate population to model for the calculation of benefit plan relativities. This can either be all members, or a subset of members in the eligibility dataset. Using a subset of the members is particularly good if the user wants to control for items such as the distribution of members by age, gender, or area, in the benefit plan relativity calculations. Sampling techniques can be used to select and combine cohorts to match the expected demographic profile of any population.
- Claim and benefit plan connectivity – Programming the claims adjudication logic is no small task as it requires extensive coding to ensure that the detailed provisions of the benefit plan are accurately represented and valued in the model. However, a good approach is to ensure each benefit category in the benefit plan maps to one associated claim type in the set of claims used for modeling, and to build the claims logic to be agnostic of the type of service. That is, code the adjudication logic to perform the same steps on each set of claim types (e.g., compute deductible then copay then coinsurance, etc.). Thus, it doesn’t matter if there are 5 benefit categories and claim types or 20, the model will all apply the same logic, and the model can grow or shrink as needed.
Sample Calculations for Claims Adjudication Models
The following example illustrates some member cost share calculations within a Claims Adjudication Model for each member in a family contract. Assume for simplicity, the plan’s benefit design is the following:
- Deductible (Embedded): ($500/$1k) (single/family)
- Embedded deductibles are a system where the carrier begins paying for each family member once the family deductible is satisfied regardless of whether the family members’ individual deductibles are satisfied. These types of deductibles are commonly found in non-high deductible health plans.
- Out-of-pocket limit: ($5k/$10k) (single/family)
- Coinsurance: 20% (all services)
- Office visits: $25 copay for first 3 visits (does not count towards deductible), then switches from copay to deductible/coinsurance for all future visits throughout the remainder of the policy year
Below is the claims experience for each family member along with their member cost share amount coded according to the plan’s benefit design (listed above). In this example, there are three family members, all of which incur claims at some point during the policy year. Member 1 has a few primary care office visits early in the year, and is then referred to a specialist physician on a quarterly basis. Member 2 has one claim, which is an emergency room visit. Member 3 has an episode late in the year, which includes a primary care physician visit where he gets blood drawn for diagnostic lab work.
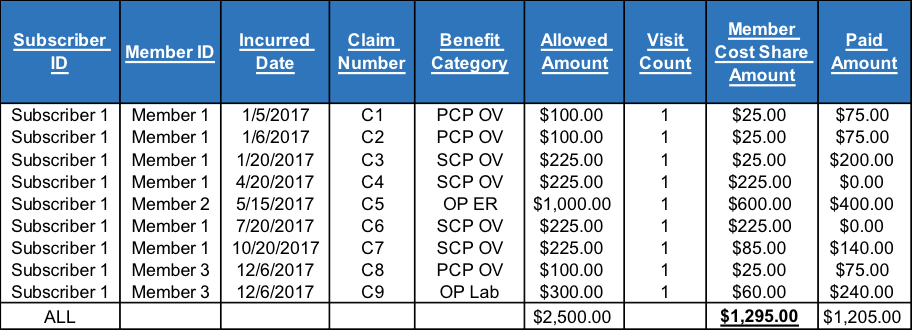
The member cost share amount column is coded according to the plan’s benefit design. For example, Member 1 pays a $25 copay for his first 3 office visits, which occur on 1/5/2017, 1/6/2017, and 1/20/2017, respectively. Afterwards, Member 1 pays towards the deductible for his office visits on 4/20/2017, 7/20/2017, as well as the first $50 of the claim on 10/20/2017, at which point his individual deductible (as well as coincidently the family deductible) is satisfied. Furthermore, Member 3 does not pay the deductible for his lab claim on 12/6/2017 since the family deductible (i.e., $1K) has already been satisfied by Member 1 and Member 2 earlier in the year, and instead, Member 3 pays 20% coinsurance for his share of the allowed amount.
The calculations above are repeated for each family contract within the cohort selected to be run through the Claims Adjudication Model. The P/A ratio for the benefit plan is then computed as the sum of the paid amount column divided by the sum of the allowed amount column across all family contracts.
Conclusion
It is the opinion of the author that Claims Adjudication Models are necessary as a full replacement (or at least as a second look) to traditional AV calculators. Claims Adjudication Models thrive where traditional AV calculators fall short, for example, in the case of properly accounting for complex plan design features in the creation of benefit plan relativity factors.