As we transition towards the 2020 elections, more and more politicians are talking about our health care system. No matter which side of the aisle one finds themselves, this continues to be a hot topic. As one side complains about what is wrong with what we have, the other side complains about the lack of a better solution. Perhaps both sides could make progress if they had a better understanding of our current health care system. This article addresses several issues that can inform that understanding.
How are Costs Distributed?
There are many ways to answer this question. We will present two important allocations of costs. First, a distribution by category of service or type of service. The second, a distribution by type of patient condition.
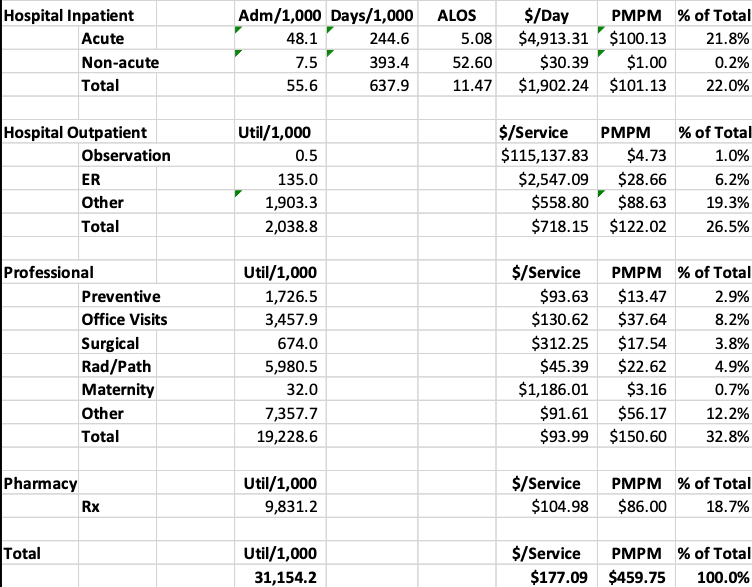
Based upon recently collected proprietary claims information, Table 1 presents a distribution of health care costs by major category of service. These are representative of allowed costs for an under-age 65 large group population (i.e., average costs per member for a large employer before benefit offsets).
Table 1 Distribution of Health Care Costs by Category of Service
The far right column shows that hospital inpatient services are 22.0% of the total health care cost. Professional services are 32.8% of the total. We find that the greatest opportunity for future cost savings is concentrated in the hospital inpatient area, in fact about 2/3rds of what can be saved is in this area.
Table 1 shows that the average cost per person per month (prior to benefit offsets) is about $460 or about $5,520 per year. These costs were based upon CY 2018 dollars.
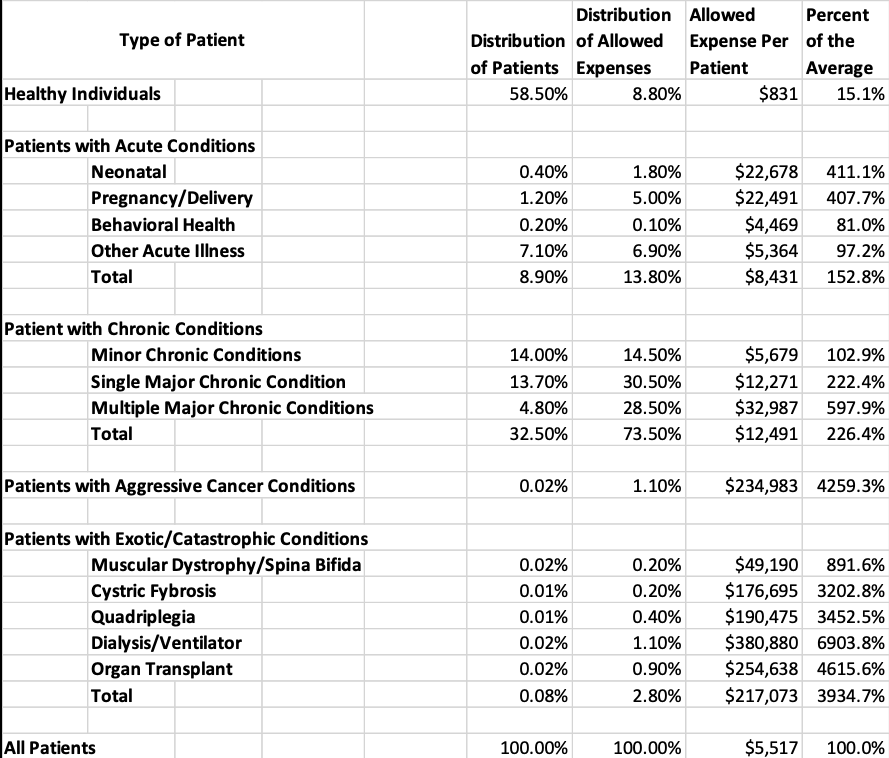
These same dollars can be distributed by type of conditions these individuals have. Table 2 presents this.
Table 2 Distribution of Health Care Costs by Type of Patient
Table 2 is quite informative showing that more than half of these individuals (i.e., 58.5%) are healthy without ongoing acute or chronic issues. Their average cost of care per person is 15.1% of the average cost per patient. Another 8.9% of the population have acute conditions with 152.8% of the average per patient cost. Almost one third of individuals have chronic conditions averaging 226.4% of the average per patient cost. The 0.02% of the population with aggressive cancer conditions consume more than 4200% of the average per patient cost. The 0.08% of the population with catastrophic conditions consume almost 4000% of the average per patient cost.
This perspective can enlighten the casual observer of the health care system. The greatest proportion of non-healthy patients are those with chronic conditions. The most expensive patients are those with cancer or catastrophic conditions.
However, all of the patient categories present opportunities for cost reductions. Even the healthy patients receive inefficient care. Some of the most expensive patients present the least opportunities for cost reductions since little can be done to improve their condition.
What Can Be Done to Improve the System?
There are many approaches that could be applied to improve the system and reduce the cost of the health care system. Some are more effective than others. Comparison of the above information to risk adjusted best in class benchmarks suggests the following approaches:
- Length of stay management: The average acute care length of stay of 5.08 days can be reduced to under 3.00 days through effective care management practices. Although this tends to increase the average cost per day, this reduces the overall cost of care by about 9%.
- Appropriate Admits: The 48.1 admits/1,000 can be reduced to about 35 admits/1,000 as patients are more appropriately treated in the outpatient or ambulatory area. This reduces the overall cost of care by an additional 4% above that mentioned regarding length of stay improvement.
- Reduced Observation and ER care: This care can be reduced by about 30%, or a 2% reduction in overall cost of care
- Other savings: An additional 2% can be saved in other areas.
- Total savings: Total savings for the impact of ideal care management practices is about 17% of current health care expenditures, a significant amount.
This reduction in cost of care should be focused across the entire health care system. However, a focus by type of patient will help target the cost improvement in the most effective way. For example, many of the chronic conditions can be significantly impacted by focusing on individual patient behavior (e.g., diet, exercise, smoking cessation, etc.). Almost three quarters of the entire system expenditures are for chronic patients. Studies suggest that costs for these conditions can be reduced by at much as 25% with improved patient behavior. This would lead to an overall cost decrease of about 18% above and beyond any of the care management savings. Achieving these results could lead to a 35% reduction in overall health care costs, a significant achievement.
Summary
If our current health care delivery system cost $3 trillion, a reduction of 35% is about $1 trillion. Based upon current costs as a percentage of GDP (i.e., more than 18%), a 35% reduction would lower the percent of GDP to 11.7%, comparable to other developed countries. Perhaps we need to focus on how we can improve the system and quit the bickering about how those on the other side of the aisle are performing.
Any views or opinions presented in this article are solely those of the author and do not necessarily represent those of the company. AHP accepts no liability for the content of this article, or for the consequences of any actions taken on the basis of the information provided unless that information is subsequently confirmed in writing.


