
Designing health benefits as if they were one-size-fits-all is a bit like issuing steel-toed boots to accountants or medical scrubs to long-haul truckers—it sounds equitable until you look at the bill. Yet, many health insurance products are still built on generalized assumptions about average populations, average costs, and average needs. The truth is, healthcare utilization isn’t average—it’s occupational. A 28-year-old retail worker and a 58-year-old utility lineman might both carry ID cards from the same insurer, but they interact with the healthcare system in radically different ways. Health plan sponsors live and die by assumptions. And when it comes to underwriting, pricing, and network strategy, the healthcare needs of every industry do not look the same. This article explores the striking—and actionable—differences in utilization patterns across five major industries and why acknowledging them is the key to building smarter, more sustainable health plans.
Hospital Inpatient: Beds, Births, and Bad Backs
Hospital inpatient utilization offers some of the starkest contrasts across industries, with Transportation/Communication/Utilities leading all industries and Services bringing up the rear. While averages may appear clustered, the underlying case mix tells a more complex story. For example, Retail Trade shows notably high maternity admissions per 1,000, higher than any other industry. This suggests a younger, predominantly female demographic in that workforce—an important context for underwriting and plan design. Contrast that with Manufacturing and Trans/Comm/Utilities, where musculoskeletal and circulatory procedures (e.g., joint replacements, stents) are more prevalent and expensive, likely tied to physically demanding job roles.
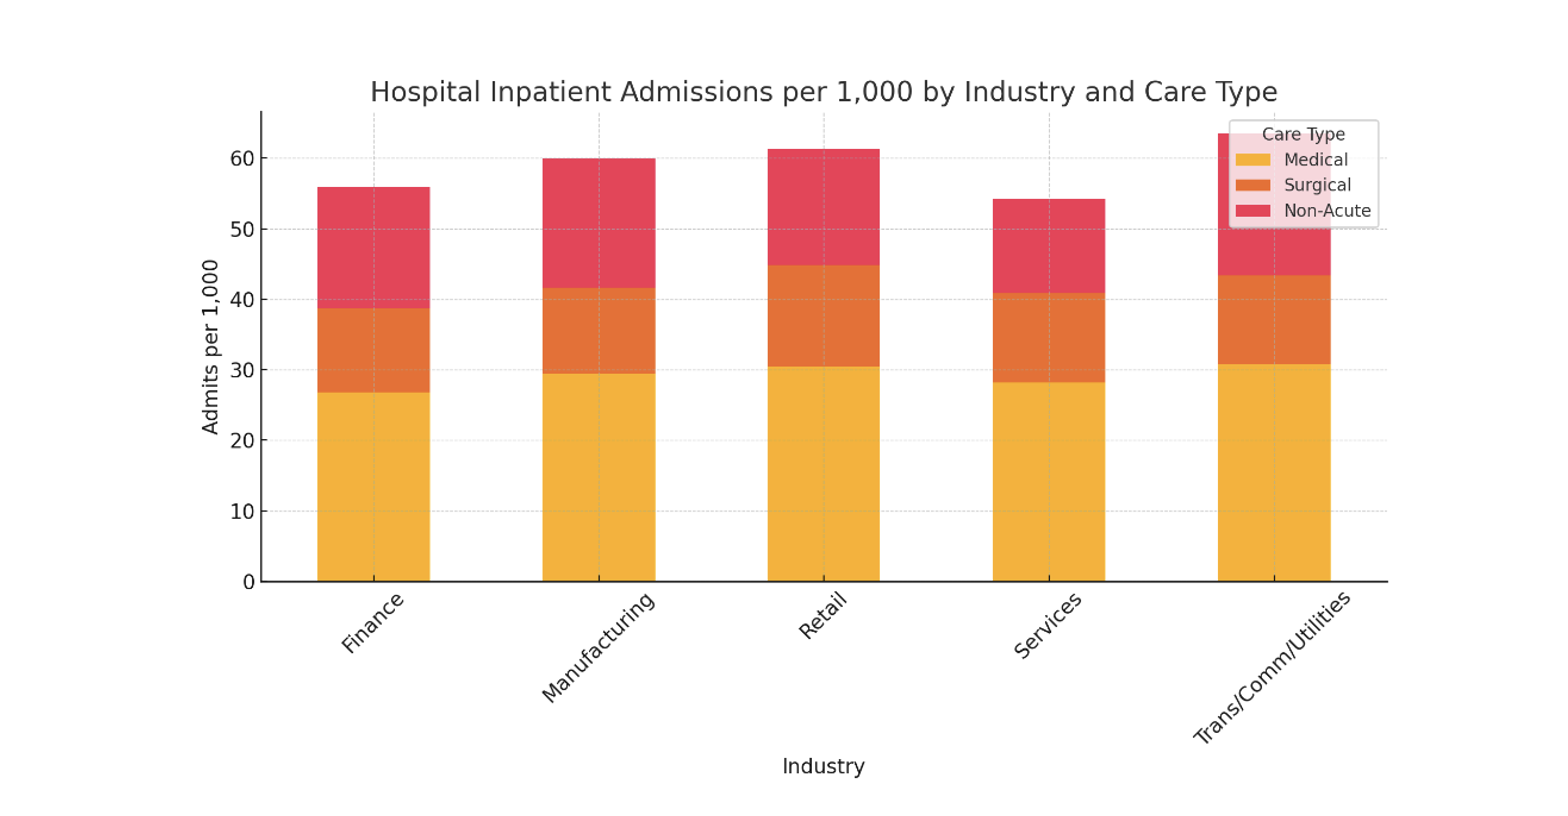
Psychiatric and substance use disorder (SUD) admissions are elevated in Finance and Trans/Comm/Utilities, with long average lengths of stay—raising concerns about behavioral health burden and productivity impact. Non-acute inpatient care (e.g., home health and skilled nursing) varies substantially, with Trans/Comm/Utilities and Retail having the highest utilization. These categories have relatively low unit costs but can reflect poor discharge planning or insufficient outpatient support.
From an actuarial lens, these differences impact not only cost forecasting but also network strategy, benefit generosity calibration, and predictive model accuracy. A plan serving a high-maternity workforce (e.g., retail) should budget for more neonatal intensive care and OB capacity, while a manufacturing-heavy block may need more orthopedic contracting leverage. Additionally, behavioral health carve-outs, length-of-stay management, and post-acute care navigation become highly industry-dependent.
Hospital Outpatient: Same Day, Different Story
Outpatient facility utilization varies widely across industries, driven by access, plan design, and care delivery patterns. Utilization by the Services industry tends to surpass all other industries, reflecting both high overall engagement and likely better access to non-emergent care. Emergency room (ER) use is highest in Retail Trade. Retail employees are often younger, lower-income, or part-time workers who may lack insurance literacy, leading them to delay care or rely on the ER as their default option. Irregular work hours and limited schedule flexibility also make it difficult to access primary care during normal hours, making the ER a more accessible—even if inappropriate—choice. By contrast, Finance and Services show lower ER use, with more pronounced use of ambulatory surgical centers (ASCs)—which offer lower-cost alternatives for routine procedures. Employees in these industries typically have higher incomes, more stable work schedules, and greater health literacy, allowing them to establish relationships with non-ER providers and access care proactively. These populations are also more likely to have comprehensive benefits and access to virtual or concierge care options, reducing reliance on the ER for non-urgent needs.
Industries with high ER reliance may benefit from virtual urgent care integration, while those with strong ASC use might demand more aggressive contracting to curb surgical inflation.
Actuarially, these patterns affect site-of-service pricing strategies, network steerage models, and trend forecasting. Industries with high ER reliance may benefit from virtual urgent care integration, while those with strong ASC use might demand more aggressive contracting to curb surgical inflation. Understanding where care occurs—and why—is essential to refining actuarial projections and supporting plan sustainability.
Professional Services: Your PCP Will See You Now—Or Maybe Not
Professional services account for the highest volume of claims in nearly every industry, but the composition between primary and specialty care reveals important distinctions. Primary care utilization is highest in Manufacturing and Trans/Comm/Utilities, indicating more frequent reliance on front-line providers, possibly for injury-related care, chronic condition management, or easier access through worksite clinics. Meanwhile, Services and Finance sectors show somewhat lower PCP visit rates but higher specialty engagement—suggesting more fragmented or referral-driven care pathways.

Specialty care dominates the overall mix in all industries, with over 75% of professional service volume in most sectors. Unit costs for specialty visits are consistently higher—averaging $235/visit across sectors vs. $150/visit for primary care—amplifying their impact on total spending. Furthermore, there appears to be an inverse relationship between primary care and specialty care utilization. The industries that utilize more primary care have lower specialty care utilization, and vice versa. Actuarially, the variation in PCP vs. specialist mix informs network adequacy standards, care coordination efforts, and referral management strategies. Plans targeting high-specialist industries may benefit from value-based reimbursement models or enhanced care navigation, while high-PCP industries may prioritize access and continuity of care to manage chronic disease burden cost-effectively.
Pharmacy: Little Bottles, Big Bills
Pharmacy utilization patterns across industries offer a compelling case study in how cost drivers diverge from service volume. Across all five sectors analyzed, non-specialty prescriptions dominate from a frequency standpoint. Yet, despite their prevalence and consistent utilization rates across industries, non-specialty medications contribute far less to overall pharmacy spending than their specialty counterparts. The divergence becomes clear when examining unit costs and PMPM impact; non-specialty drugs cost per script is approximately 5x lower than the average cost per script for specialty drugs. This imbalance is especially visible in sectors such as Finance, Insurance, and Real Estate, where specialty drugs make up just 6% of scripts but represent nearly 70% of pharmacy spend.
Specialty drug utilization varies meaningfully across industries, reflecting differences in workforce morbidity, benefit design, and access to high-cost therapies. Finance/Insurance/Real Estate leads in specialty drug spending, likely due to greater prevalence of chronic or complex conditions and broader coverage for high-cost medications. In contrast, Transportation/Communication/Utilities shows the lowest specialty drug use and spend, suggesting more restrictive formularies, lower disease burden, or barriers to specialty care access. Manufacturing, Retail, and Services occupy a middle ground, with moderate specialty usage and spending patterns that balance affordability with clinical need. These differences highlight the importance of tailoring pharmacy strategy to industry-specific risk profiles.
Pharmacy cost containment strategies cannot rely on utilization management alone; they must also consider site-of-care optimization, formulary tiering, and value-based contracting with pharmacy benefit managers. Moreover, although traditional utilization patterns for non-specialty drugs remain relatively stable across industries, the rapid evolution and pipeline growth of specialty therapies—especially gene and cell therapies—means that what is today a concentrated cost driver could soon become a broader systemic challenge. Actuarial models must account for this asymmetry in both pricing volatility and clinical impact when forecasting future costs or evaluating benefit design trade-offs.
Conclusion: The Actuarial Tailor
The data presented across inpatient, outpatient, professional, and pharmacy services point to a clear actuarial finding: industry matters and utilization patterns diverge meaningfully based on workforce characteristics. These patterns are not random—they stem from industry-specific differences in demographics, occupational risk, access to care, and underlying morbidity. The result is a complex landscape where applying generic pricing models or one-size-fits-all benefit designs risks both financial inefficiency and misaligned or unsatisfactory member experiences.
Actuaries and health plan designers must take a more nuanced approach, one that incorporates industry segmentation into cost forecasting, trend development, network configuration, and benefit architecture. High-maternity industries may require richer OB/GYN networks and NICU forecasting models, while those with intensive physical labor may benefit from targeted musculoskeletal case management and onsite primary care integration. Similarly, managing pharmacy trend in any sector today requires a laser focus on specialty drugs, but the pathway to cost containment may vary: formulary control and rebate leverage in Finance may be effective, while steerage and adherence strategies may be more impactful in blue-collar populations.
Ultimately, actuarial models that incorporate industry-specific assumptions—about utilization, price elasticity, and care delivery patterns—are not just more accurate; they are essential for sustainability in a healthcare system increasingly defined by complexity, personalization, and cost pressure. As benefit sponsors, regulators, and carriers navigate the evolving healthcare environment, recognizing the influence of industry on healthcare utilization is a critical step toward better outcomes and smarter pricing. One size doesn’t fit all—and with the right actuarial tools, it doesn’t have to.
Any views or opinions presented in this article are solely those of the author and do not necessarily represent those of the company. AHP accepts no liability for the content of this article, or for the consequences of any actions taken on the basis of the information provided unless that information is subsequently confirmed in writing.
About the Author
