
There appears to be an association between the reopening date for elective dental procedures and the volume of dental patient visits—early-open states had a quicker utilization ramp-up, but states that opened later ended up with higher utilization by the end of the summer.
Introduction
Dental claims fell off a cliff in March. The drop was precipitous. The drop was also ubiquitous, hitting practices of all sizes and across varying geographic regions.
Many health care providers experienced the claims cliff this spring. However, dentists experienced steeper claims dive than most other health care providers. Our internal data suggests that while claims for some medical groups declined about 30% from expected in April, claims for dentists in the same period declined 90% from expected. It was a sheer, cataclysmic drop. And the recovery is still ongoing.
We spent the spring and summer weathering COVID-19 surges and economic cliffs. We are nearing the end of August now, and it appears that COVID-19 cases may be plateauing, perhaps waning.
However, the pandemic is ongoing, and we stand on the precipice of the seasonal flu season. There is some speculation that the flu could worsen the pandemic[1], which could potentially result in another round of protective lockdowns.
It’s a useful exercise for anyone analyzing dental claims to review the experience of the spring and summer. Did patient demand return more quickly for states that reopened earlier?
Given this possibility, it’s a useful exercise for anyone analyzing dental claims to review the experience of the spring and summer. Did patient demand return more quickly for states that reopened earlier? Were COVID-19 infection surges correlated with claims decreases, even when offices remained open for business? What are the trends in patient demand now?
Below, we will explore the factors associated with dentistry’s ongoing recovery, including timing for resumption of elective procedures, the timing of COVID-19 case surges, and current utilization trends.
Background on Dental Reopening Policy
On March 16, 2020, dentists were guided by the largest dental professional organization, the American Dental Association (ADA), to cease performing any procedures that were not emergencies[2]. The ADA guidance was intended to last three weeks, but faced with PPE shortages and rising caseloads, on April 1 the ADA extended the guidance to postpone elective procedures through the end of the month. The recommendation to postpone elective care was not extended beyond April 30[3].
However, many offices resumed elective dental care prior to April 30, in accordance with guidance from their state and local authorities. In fact, 30 states allowed the return of elective dental care over the same two-week period in late April/early May[4], as shown in Table 1 below.
Table 1: Timeline for Allowance of Elective Dental Procedures in the U.S.
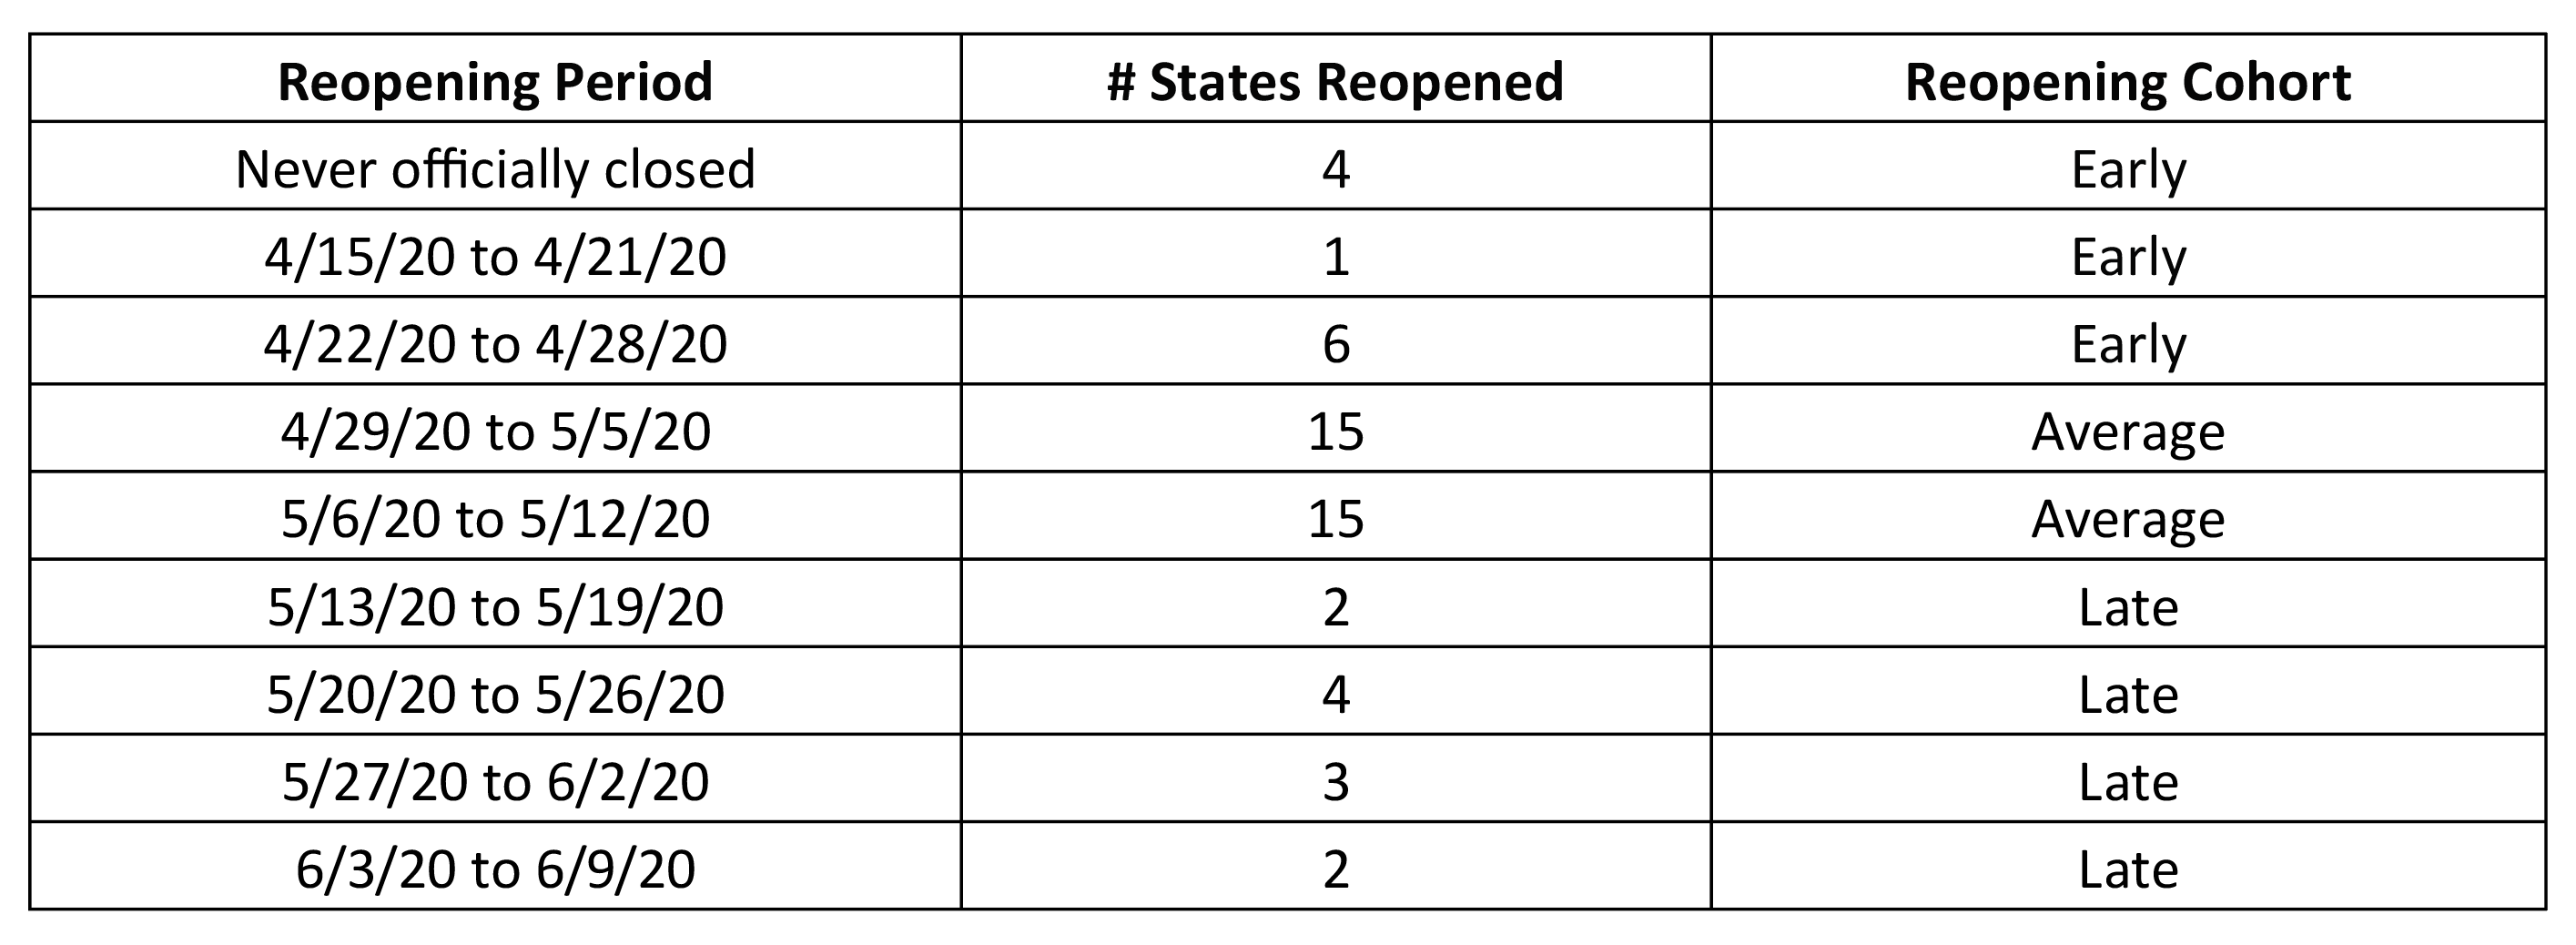
The other 20 states reopened for elective dental care either before or after that two-week period, including four state governments that never officially prohibited elective procedures. Puerto Rico and Washington, D.C. were included in this analysis as well[5], with reopening dates in late May for both. Individual dental offices continued to open over the course of the summer[6], with 98% of offices open by August[7].
Impact of Reopening Date on Patient Volume
We focused on the top 20 jurisdictions by self-reported patient volume[8], organized by “reopening cohort” as shown in Table 1. As shown in Table 1, there were 11 jurisdictions in the “early” reopening cohort, 30 “average”, and 11 “late”.
Higher patient volume represents higher utilization, which is associated with higher revenue (depending on the mix of services and payer). For simplicity, we will interpret the 20 states with the highest patient volume to be those with the most successful recovery.
For example, Puerto Rico had the highest patient volume in April, at 19% of baseline levels. However, in May, Puerto Rico was number 33 for patient volume, and in June, it was last, with patient volume only at 36% of baseline levels. For comparison, by June most jurisdictions had a patient volume of at least two-thirds of baseline levels.
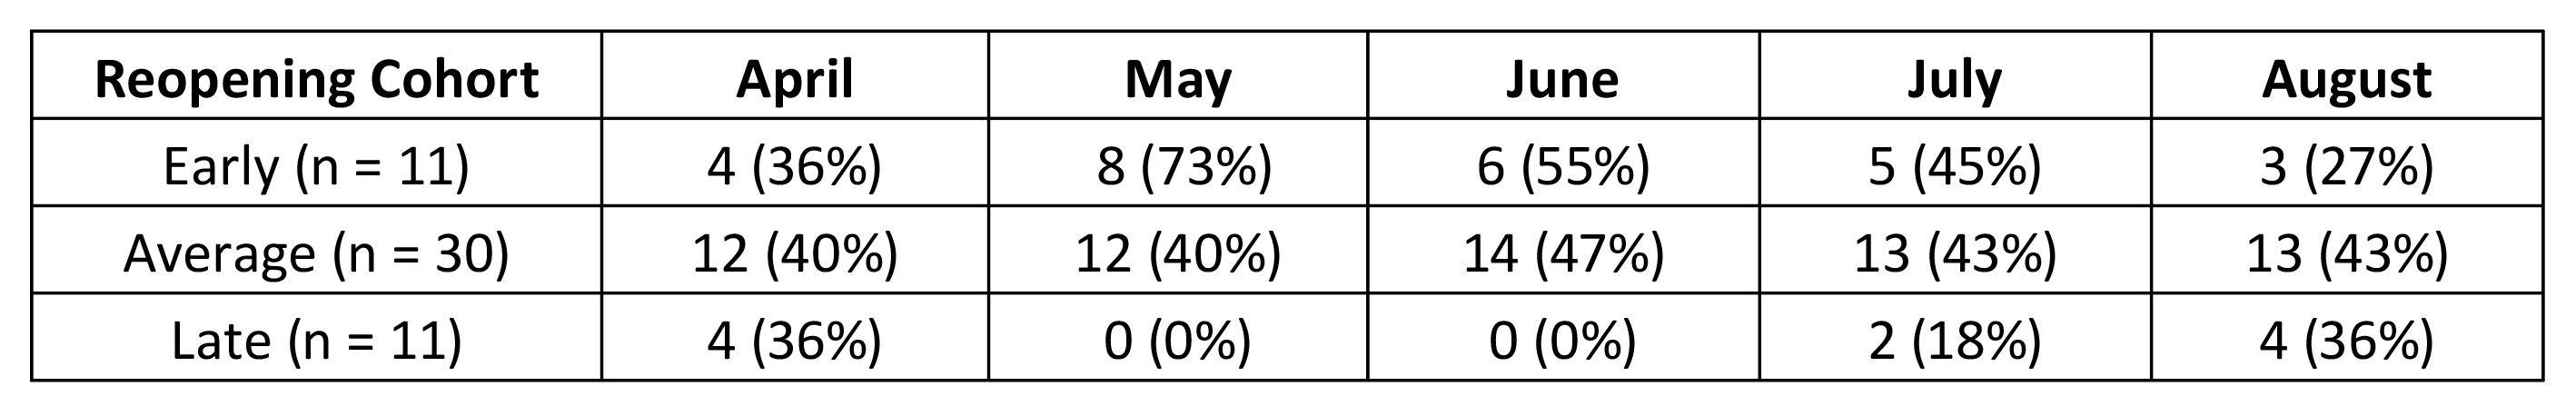
Table 2 below shows the reopening cohort of the top 20 states in each month, along with the fraction of the cohort represented in the top 20 list. For example, in April, the top 20 “best” states included:
- 4 that reopened early
- 12 that reopened in that average 2-week window
- 4 that reopened late
In parentheses in Table 2, we show the fraction of the cohort represented in the top 20 states. In May, of the top 20 states, 8 reopened early and 12 reopened in the average window. There are only 11 early states, so 73% of them (8/11) were represented in the top 20, while 40% of average cohort states (12/30) were represented in the top 20.
Table 2: Reopening Cohort for 20 Highest-Volume Jurisdictions in Each Month
There are a few main takeaways from Table 2:
Takeaway 1: April was bad
As expected, most jurisdictions were hit hard in April. The top 20 best jurisdictions for patient volume were evenly distributed amongst early, average, and late cohorts, with each cohort represented at 36-40% of the total. The best states looked a lot like the worst states because offices were pretty much closed across the board in April. Patient volume across all jurisdictions averaged just 7% of baseline.
Takeaway 2: Early cohort states had a quicker recovery
As one might expect, states that opened early appeared to have a quicker leap in utilization. In May, almost all the early states (8 out of 11) are in the top 20 list.
Takeaway 3: Late cohort states had a more robust recovery
By August, there were more late cohort states in the top 20 list than there were early states (4 late versus 3 early). This could indicate that although the rebound occurred more quickly in states that reopened earlier, there was a more robust rebound in states that reopened later. The higher patient volume in late-reopening states could be a function of patients feeling safer about visiting their dental provider. For example, as of late August, Michigan appears to be containing the virus to a better extent than many other states[9], and over the course of June to August, Michigan rose from number 33 to number 13 to number 7 in the patient volume rankings.
Association Between June COVID-19 Surge and Patient Volume
We also looked at the top 20 patient volume states by COVID-19 surge status[10]. We focused on states that experienced a June surge[11]. In Table 3 below, we group the top 20 jurisdictions in each month by whether or not they experienced a surge of COVID-19 cases in June.
Table 3: June Surge Status for 20 Highest-Volume Jurisdictions in Each Month
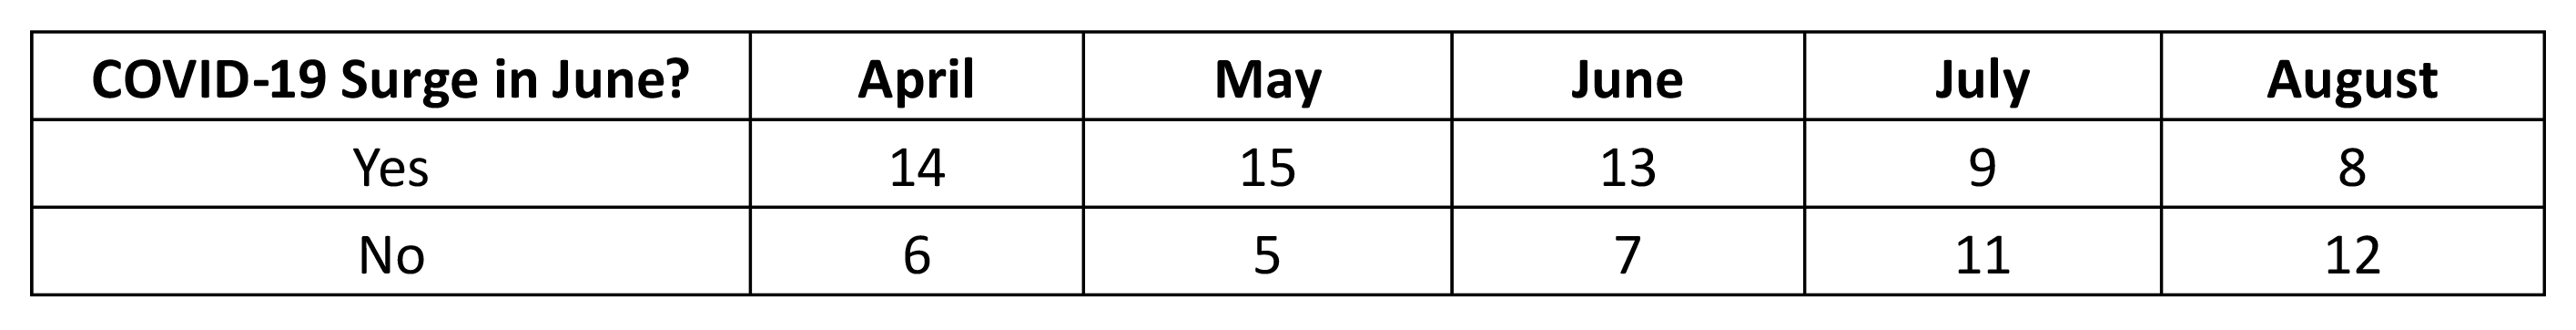
As shown in Table 3, we found that about three-quarters of the top 20 states in April and May went on to have a surge in June, while less than half of the top 20 states in July and August had experienced a surge in June. This could indicate more robust recoveries in jurisdictions that had the virus under better control, but quicker recoveries in jurisdictions that subsequently experienced surges.
Of the 15 states that made the top 20 list in May only to experience a surge in June, only 6 remained in the top 20 list by August. For example, Louisiana dropped from number 12 to number 40 in that period.
It’s important to note that elective dental procedures are likely not themselves a cause of COVID-19 outbreaks, and millions of people have safely visited their dentist since the pandemic began[12]. But it does appear that regions with higher patient traffic early on experienced summer surges, while regions that avoided summer surges ended the season with relatively high patient volume.
Current Trends
Finally, we considered whether patient volume might be stabilizing. July and August look quite similar, with all jurisdictions but Puerto Rico ranging from 63% to 84% of baseline levels. The average patient volume in July was 73%, while in August it was 74%. By comparison, April through June was 7%, 32%, and 64%, respectively. So it does seem to be the case that patient volume is leveling out at this new level. This is illustrated in Figure 1, below, which demonstrates patient volume as a percent of baseline in each month for each state. Lighter colors indicate low patient volume (as low as 3% in April, for North Dakota), while darker colors indicate higher patient volume (as high as 84% in August, for Idaho).
Figure 1: Patient Volume as a Percent of Baseline in Each Jurisdiction, By Month
Even the highest-volume states in August are still at least 15% lower than baseline utilization levels. Persistent lower-than-baseline utilization could be attributable to a number of factors:
- Some patients are still anxious about seeing their dentist, and might even wait until there’s a vaccine
- Infection prevention and control protocols limit the number of patients that can be seen per day to a lower threshold than the pre-pandemic baseline, even with expanded office hours
- Social distancing restrictions (whether mandated or not) limit the number of patients that can be seen per day
- Personal protective equipment is limited and may limit the staff’s ability to see a higher volume of patients
For these reasons, the 85% threshold may be an upper bound. It is too early to tell at this point.
Looking Ahead
Though recovery is ongoing in every jurisdiction, we found that regions with later reopening dates appeared to end the season with higher patient volume than those with earlier reopening dates. We also found that patient volume was higher in August in regions that did not experience a surge over the summer.
Winter is coming. As we keep an eye on emerging claims experience, we should also be cognizant of the local COVID-19 caseload and reaction of the broader community. There is an association between COVID-19 surges, reopening dates, and patient volume. Demand for dental care will continue to be intermingled with the pandemic and our reactions to it. Using the lessons of the spring and summer hopefully, this time we can avoid falling off the claims cliff.
[1] https://jamanetwork.com/journals/jama/fullarticle/2769835
[3] As recently as August 3, the WHO issued guidance that routine dental procedures should be avoided in geographic locations with uncontrolled community transmission. As of late August, much of the U.S. is still experiencing uncontrolled community transmission. However, the ADA and CDC continue to recommend that dental practices serve their patients as long as they are able to follow infection prevention and control protocols.
[5] In this discussion, I use the term “state” interchangeably for the term “jurisdiction” for simplicity, though the analysis does include Puerto Rico and Washington, D.C.
[6] Even where elective procedures were permitted, it was up to each business to decide if and when they would reopen their office.
[8] https://www.ada.org/en/science-research/health-policy-institute/covid-19-dentists-economic-impact?&utm_source=cpsorg&utm_medium=covid-main-lp&utm_content=cv-hpi-covid-lp&utm_campaign=covid-19. Note that these are survey results and as such include self-reported data, which may be biased, and there were some states which returned fewer than 30 responses to the survey. Data for those states may be unreliable. All jurisdictions have been included in this analysis for completeness, but the quality of the data may affect the conclusions.
[9] https://www.covidexitstrategy.org/, accessed August 25, 2020
[10] We used the second derivative of the cumulative case count on a 7-day rolling average to determine the periods in which each state was surging.
[11] Defined as having at least 7 days in June when the rolling average case count accelerated at least 9% over a 3-day period, with the change in the case count over that period exceeding 3%.
About the Author

Any views or opinions presented in this article are solely those of the author and do not necessarily represent those of the company. AHP accepts no liability for the content of this article, or for the consequences of any actions taken on the basis of the information provided unless that information is subsequently confirmed in writing.