
Any views or opinions presented in this article are solely those of the author and do not necessarily represent those of the company. AHP accepts no liability for the content of this article, or for the consequences of any actions taken on the basis of the information provided unless that information is subsequently confirmed in writing.
The macroeconomic environment is radically shifting as inflation ratchets up costs in every consumer category, including health care. AHP has already written extensively on broader inflation’s impact on trend, painting a more bearish outlook in the coming years as healthcare inflation lags CPI. Recently published URRT filings and healthcare.gov data offer insight into how health plans are responding both with their rates as well as their plan designs and cost-sharing.
Individual Exchange Summary
Combining data from healthcare.gov and URRT filings provides a unique perspective on how plan designs relate to rating information. Exhibit 1 shows some summary statistics for individual exchange plans offered through healthcare.gov in 2023. Projected member months and actuarial values come from the URRT filings, while the deductible, max out-of-pocket (MOOP), and premium come from healthcare.gov. The averages are calculated as a weighted average based on projected membership to better reflect what members actually choose.
Exhibit 1: 2023 Individual Market Summary
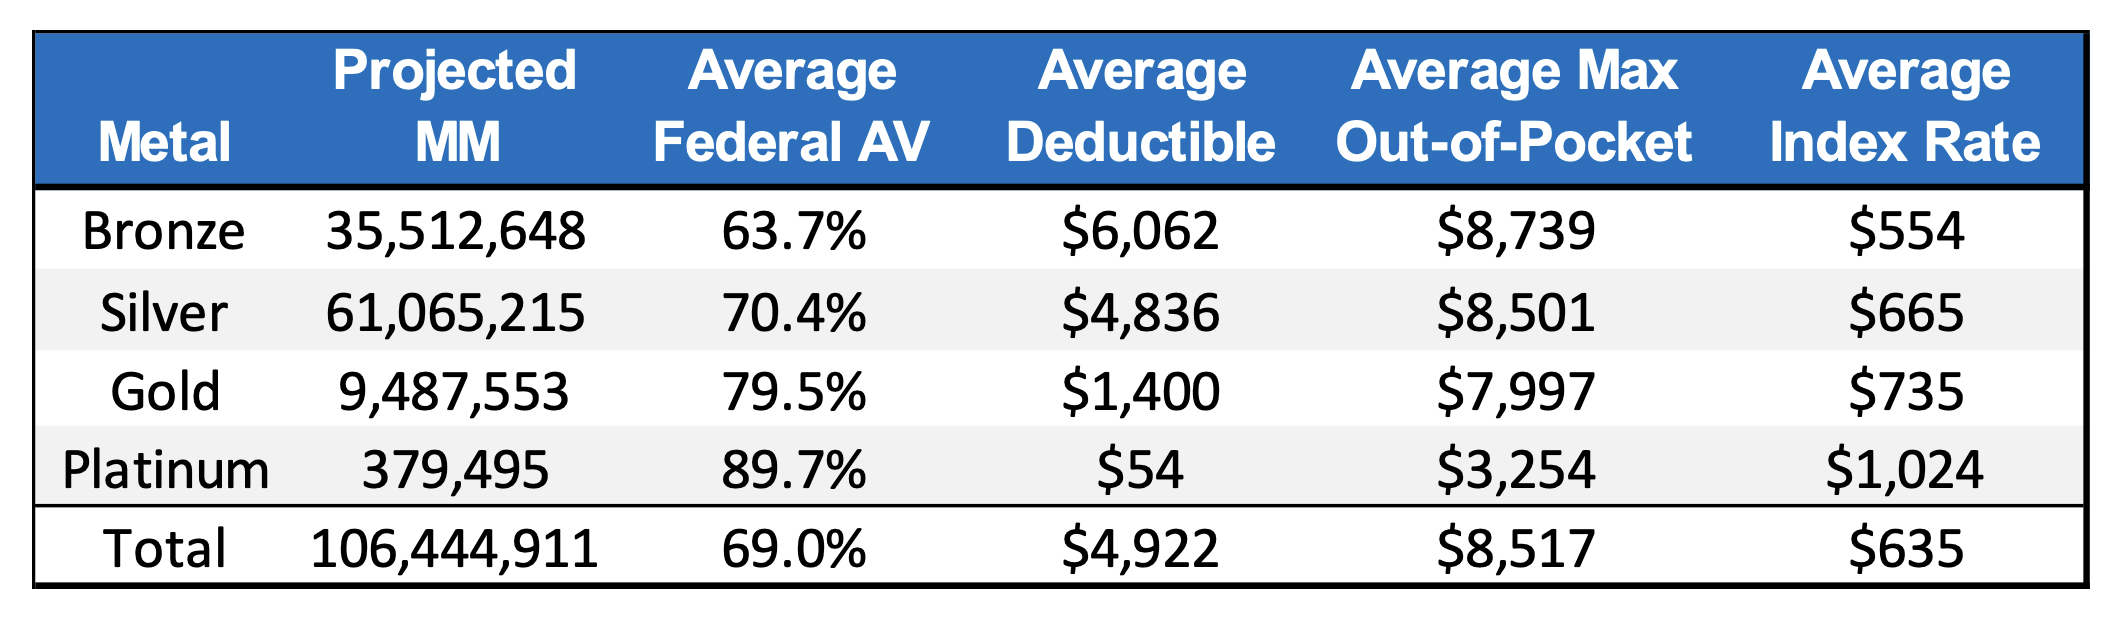
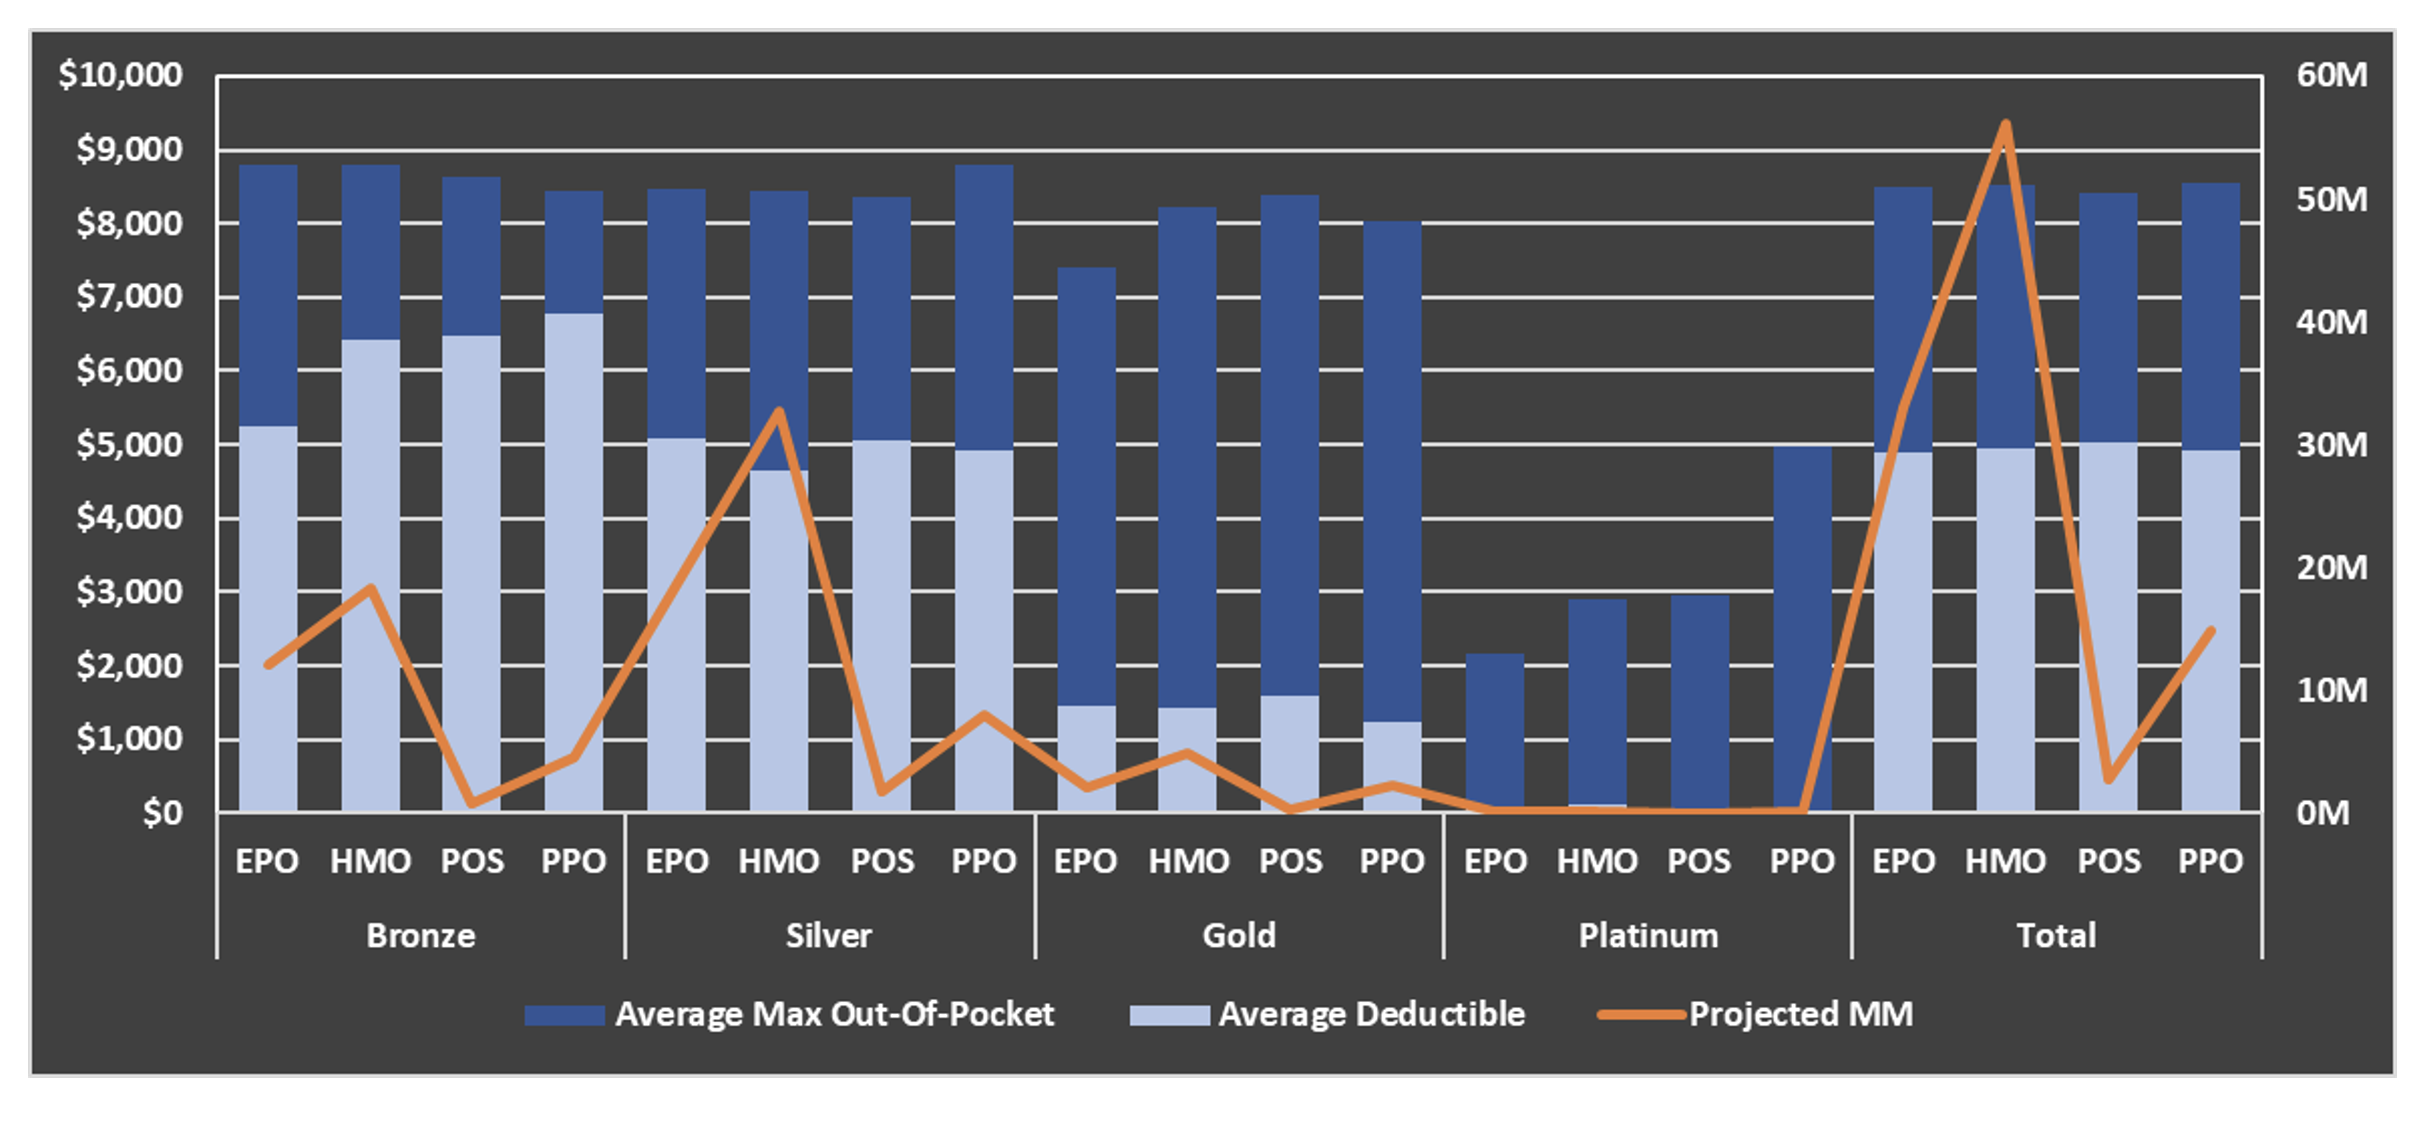
There are a few common themes noticeable in Exhibit 1, such as the dominant silver market share. Deductibles and MOOPs also follow typical yet noteworthy patterns: deductibles are the primary lever of cost-sharing while MOOP isn’t substantially changed until the platinum tier. These are displayed graphically in Exhibit 2, which also breaks out plan type. The graph reveals that most of the silver membership comes from HMO plans, which offer the lowest deductible.
Exhibit 2: 2023 Plan Design & Projected MM
More noteworthy observations can be made by comparing the change relative to 2022 statistics. Exhibit 3 shows these changes relative to 2022, which reflects how the market is adapting to past and anticipated market experience.
Exhibit 3: 2023 Individual Market Changes Relative to 2022
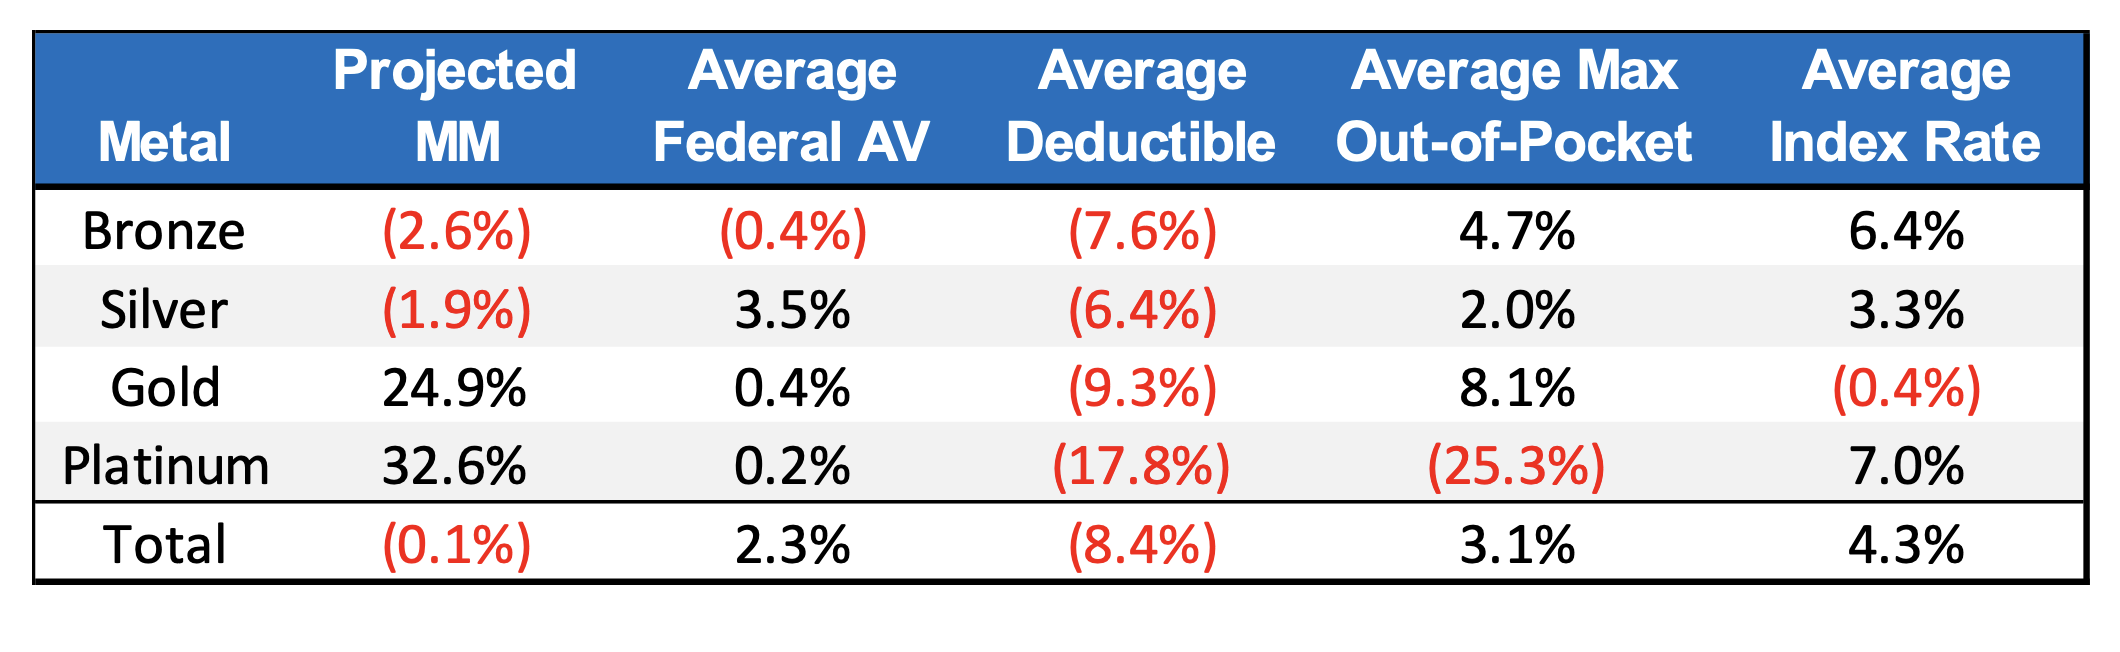
Projected membership is expected to shift away from bronze and silver plans, increasing gold and platinum. Average deductibles have dropped in all tiers. Despite the lower deductible, the actuarial value decreased in bronze and remained relatively unchanged in gold and platinum. For these tiers, carriers seem to be subtly shifting rising costs onto members while offering a “carrot” of earlier cost-sharing. This is further exemplified by the increasing max out-of-pockets for all tiers except platinum, which as mentioned before is the only tier where MOOP becomes a meaningful cost-sharing lever.
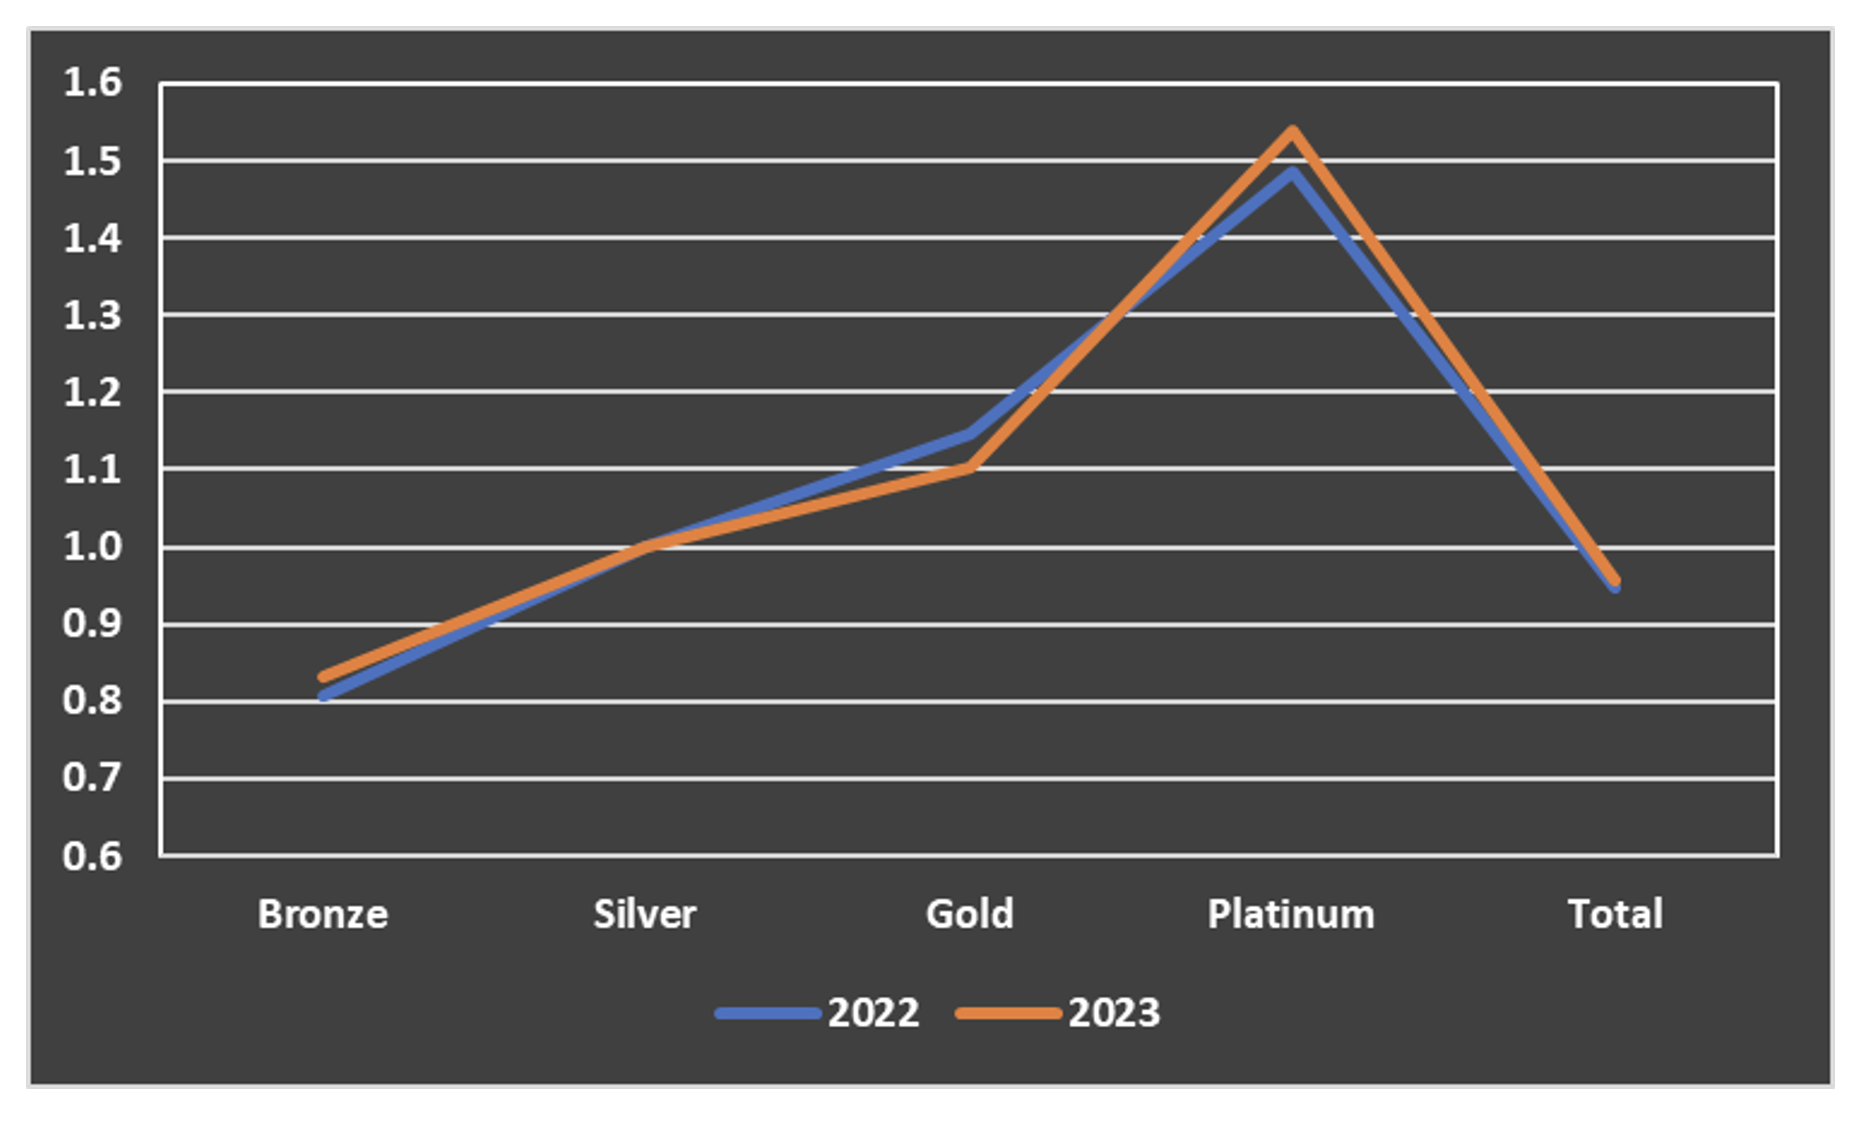
The decrease in gold premium is striking compared to the increases in other tiers. This demonstrates the impact of “premium alignment”, which Axene Health Partners has helped implement in various jurisdictions[1]. It also helps explain the shift of membership away from bronze and silver plans towards gold. Exhibit 4 shows how bronze and gold premiums have shifted closer to silver while platinum has shifted higher.
Exhibit 4: Premium Ratios
Deep Dive: Wisconsin PCP Cost Sharing
The same data used to derive the overall summary can be used to provide deeper insights into a particular market. For example, in a competitive market such as Wisconsin, it’s important to understand how cost-sharing elements of a carrier’s plan design align with that of competitors. Exhibit 5 shows the top 5 PCP cost-sharing designs of silver plans based on the 2023 projected membership distribution.
Exhibit 5: PCP Cost Sharing in Wisconsin
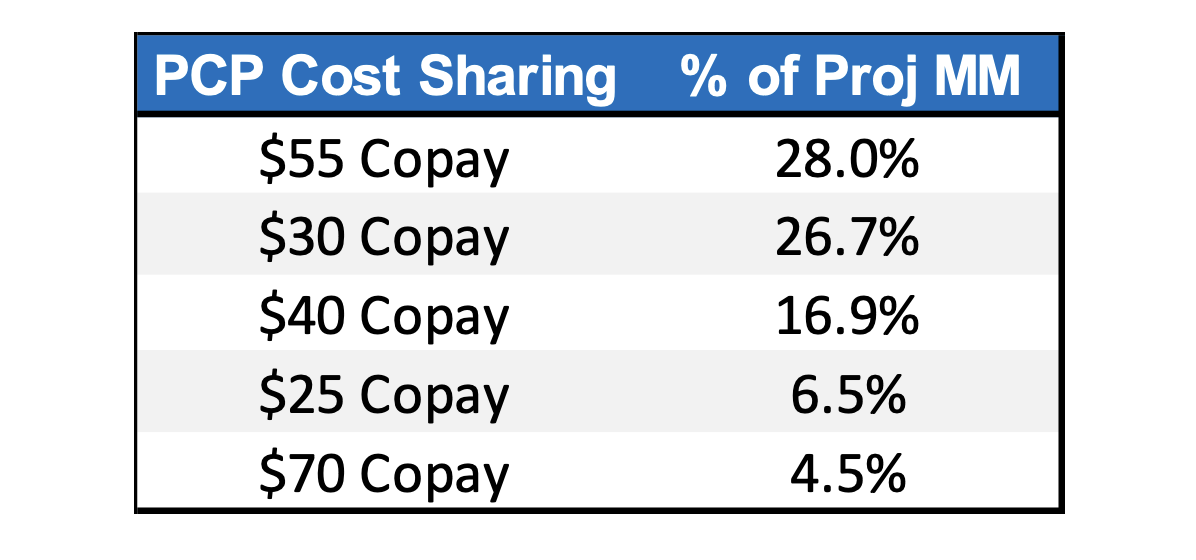
The $55 copay has the largest percentage of projected membership and is almost entirely associated with a $5,650 deductible. Meanwhile, about 45% of the members with a $30 copay are coupled with a $2,500 deductible. Naturally, the rate for the higher deductible and copay is lower; carriers in WI can observe the aggregation of membership around these plan designs and consider what other cost-sharing features might provide a competitive advantage. These types of dynamics can provide valuable strategic insights to carriers considering plan design changes for upcoming years.
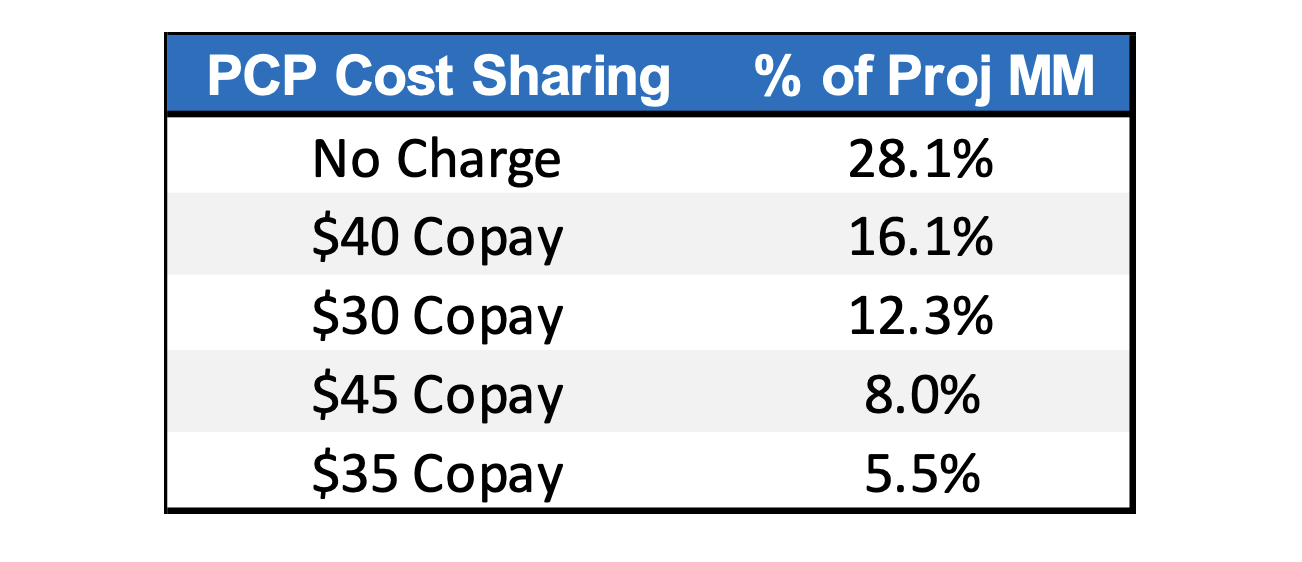
PCP cost sharing in Wisconsin differs markedly from the national average. Exhibit 6 shows the top 5 PCP cost-sharing designs for silver plans offered through healthcare.gov. Most members are enrolled in plans that do not charge for PCP visits, compared to only 3.3% in Wisconsin. The average deductible for the “No Charge” plans is $4,519 which is less than the $55 copay plan in Wisconsin. Furthermore, only about 10% of members have a PCP copay of more than $50 as opposed to 36% in Wisconsin. Wisconsin carriers would be wise to consider whether the deviation from national averages presents an opportunity for a carrier to capture market share or if it’s reflective of unique Wisconsin dynamics.
Exhibit 6: Healthcare.gov PCP Cost Sharing
The same distribution can be generated for a variety of cost-sharing elements such as specialist visits, ER visits, inpatient stays, and pharmacy. Carriers can benefit from surveying competitors’ plan designs and what features seem to be correlated with high membership. Different markets may prioritize different services as utilization can vary dramatically based on geography.
Conclusion
As enrollees continue to face economic hardship over the next year, health plans have a variety of considerations to retain and grow membership. In 2023, plans seem to be trading lower deductibles for lower cost sharing. Even seemingly minor competitive advantages such as strategically tailoring cost sharing to a particular population can produce worthwhile returns.
[1] https://prospect.org/health/texas-legislature-learned-to-stop-worrying-and-love-aca-marketplace/
About the Author
