Much of the media coverage surrounding the COVID-induced economic situation typically pertains to the historic unemployment numbers, number of business closures, and the potential need for additional government stimulus to sustain the economy through this trying season. We all yearn for a return to our full economic potential after making sacrifices for the sake of “flattening the curve”. However, with that objective largely achieved the goalposts have shifted and our hopes to reignite our latent economy now rest in the timely delivery of an effective vaccine. This new objective differs from curve flattening in several important manners: a less defined and knowable timeline, existence of scientific unknowns, and its effort being concentrated in a small number of elite scientists as opposed to a collective societal effort.
Most of us have heard the ominous suggestions that immunity to COVID might not be permanent, implying a vaccine will not be the panacea for our medical and economic woes. An effective risk management approach does not blissfully ignore that possibility; rather, risk management requires addressing this scenario directly. While still not ideally accurate, we now have enough data to make some educated risk-mitigating calculations to best adapt under a “new normal” where COVID has not been eradicated via vaccine. Under such a scenario, there are two unavoidable and difficult truths that must be accepted: we cannot rely on perpetual stimuli from the government and COVID will continue to tragically take some lives. These necessitate taking strict precautions to return to work and minimizing the damage inflicted by COVID.
If an adequately effective vaccine is not available by early-2021, we will need to implement a measured and tactful return to a functioning economy.
Actuaries notoriously make quantifications that others might find disconcerting, such as the value of human health or life. Shielded behind our desks and computers, we charge into the cloud of uncertainty wielding data to settle difficult questions. Furthermore, every public policy consists of an educated cost-benefit analysis. Governments set speed limits with the understanding that each lower mile-per-hour leads to an estimated lower number of car accidents. If an adequately effective vaccine is not available by early-2021, we will need to implement a measured and tactful return to a functioning economy.
I make an effort to not extend beyond my ERM expertise. This article simply utilizes publicly available data from the Bureau of Labor Statistics, Bureau of Economic Analysis, and the Center for Disease Control to provide a framework by which we can strategize a return to work. Actual public policy decisions will need to consider an abundance of additional information from a variety of experts.
Identifying Risk: Populations
It is common knowledge that the elderly are particularly vulnerable to COVID-19, with nursing homes accounting for more than 40% of deaths[1]. A responsible economic shutdown policy would consider how much of the economy and which segments rely on the at-risk populations.
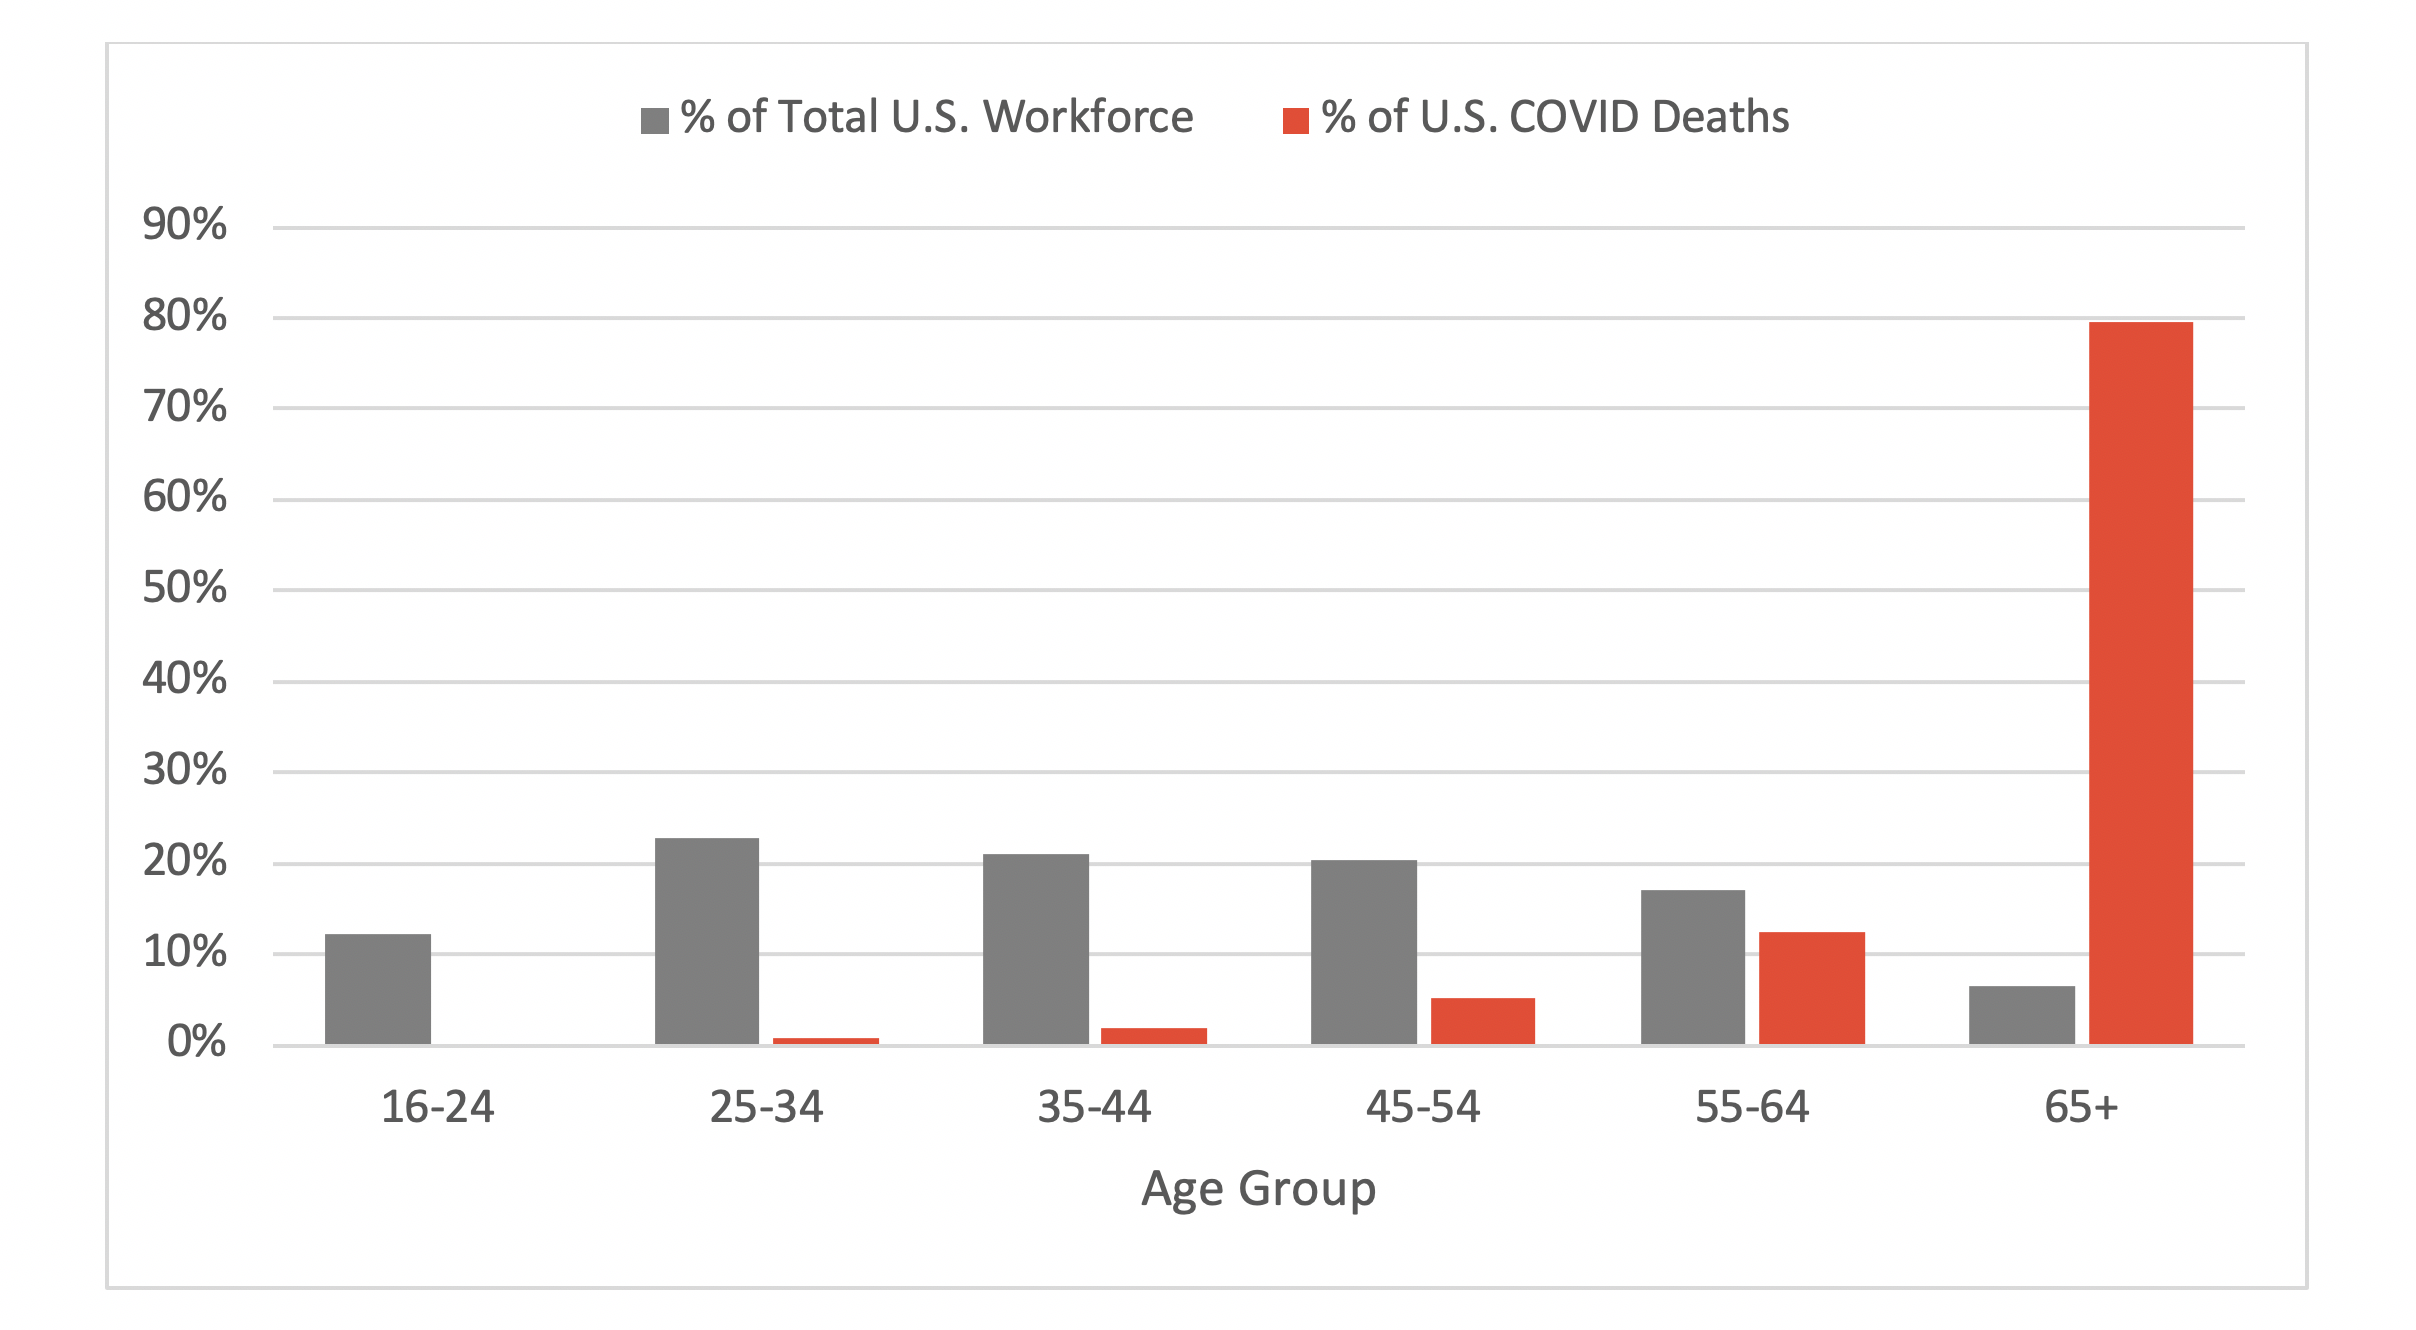
Chart-1: COVID-19 Deaths and Workforce Participation by Age Group
Chart-1 demonstrates that the <55 age group represents 76% of the U.S. workforce and only 8% of all deaths. Furthermore, the 65+ age group accounts for only 7% of the U.S. workforce and 80% of deaths. Understanding that there is a lot of intricacy surrounding how to prevent the spread of infection at an individual level, this suggests that a large portion of the workforce is significantly less at-risk and can return to work with rigorous safety measures. When shutdowns are applied and the only distinguishing measure is whether a business is “essential”, the government is engaging in precautionary policies that are high-cost, loosely targeted, and relatively ineffective.
It is easier for the elderly population to maintain their economic consumption while socially distanced, meanwhile the shutdowns broadly hamper production across all ages and non-essential industries. An effective policy would minimize economic damage by identifying industries and occupations that have significant portions of their workforce vulnerable to COVID. After assessing the overall economic contribution and necessity of those industries and occupations, various precautionary measures could be enforced as appropriate. In some cases, shutdowns may indeed be appropriate. Other industries or occupations may simply require innovative measures that minimize in-person interaction with the at-risk population[2]. As evidenced by the concentration of deaths in nursing homes, targeted measures can prevent a significant amount of deaths with minimal economic damage. Therefore, an effective return-to-work risk management framework begins with risk identification
Identifying Risk: Industries
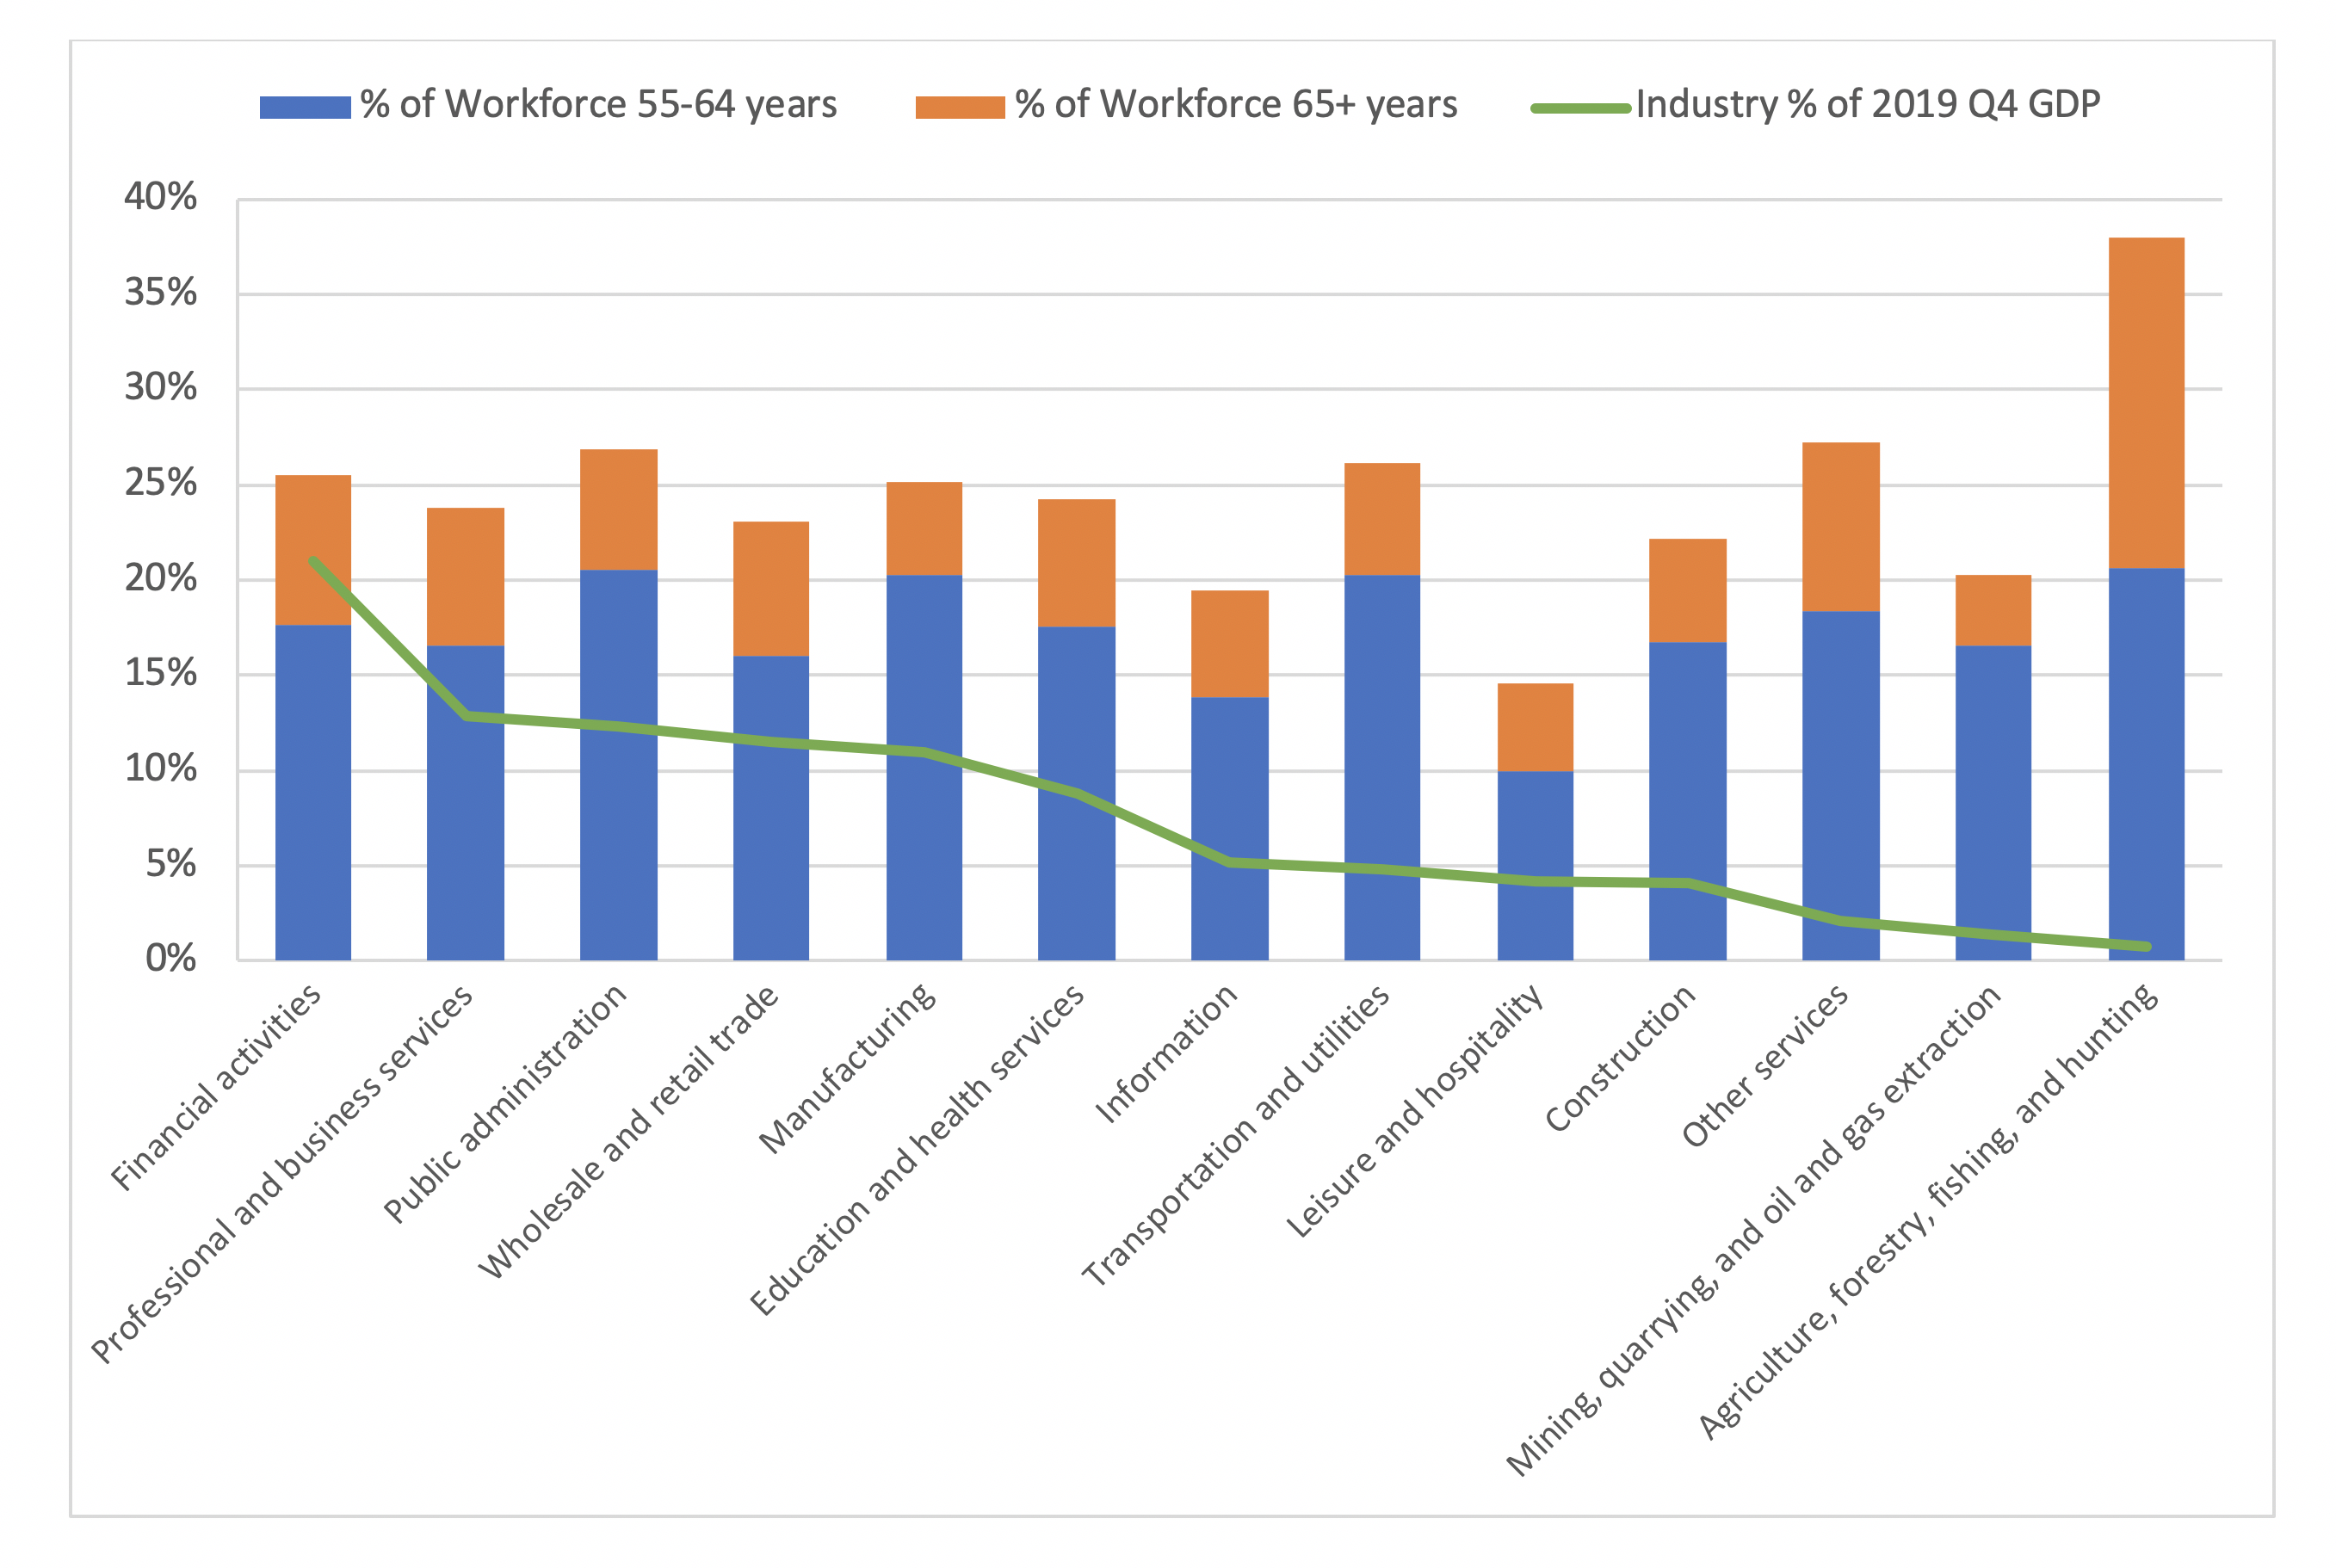
Chart-2 shows various industries and columns that show the percentage of the workforce in an at-risk age demographic. Furthermore, the green line shows the value added to the 2019 Q4 GDP for each industry. The industries are arranged in descending order of contribution to GDP.
Chart-2: % of Workforce in Age Group and % of GDP by Industry
The most striking observation is that Agriculture, Forestry, Fishing, and Hunting has the substantially oldest workforce but contributes the least to GDP. However, many of these jobs might be considered essential activities so any return to work should take strict precautions where needed or train a younger workforce. The industries that contribute the most towards GDP (Financial Activities, Professional and Business Services, and Public Administration) are largely office-based and can leverage technology to enable remote work. Altogether these industries comprise 46.2% of GDP.
Most of the increase in unemployment is attributable to either an incapability for remote work or suppression of demand. However, specific industry sub-categories such as retail trade (22.5%), arts & entertainment (22.0%), and accommodations & food services (12.3%) all consist of workforces with a low percentage of workers age 55+. The question remains that if restaurants, shops, and entertainment were to resume operations, would the demand be high enough to employ all the latent workforce. This is a consumer behavior question that is beyond the scope of this article and depends on a complex variety of influences. However, it is likely that in a return-to-work strategy modeled after Sweden, where elderly people are encouraged to quarantine while all others are encouraged to resume life-as-usual, there could be enough consumer demand to at least partially re-invigorate these industries.
Identifying Risk: Occupations
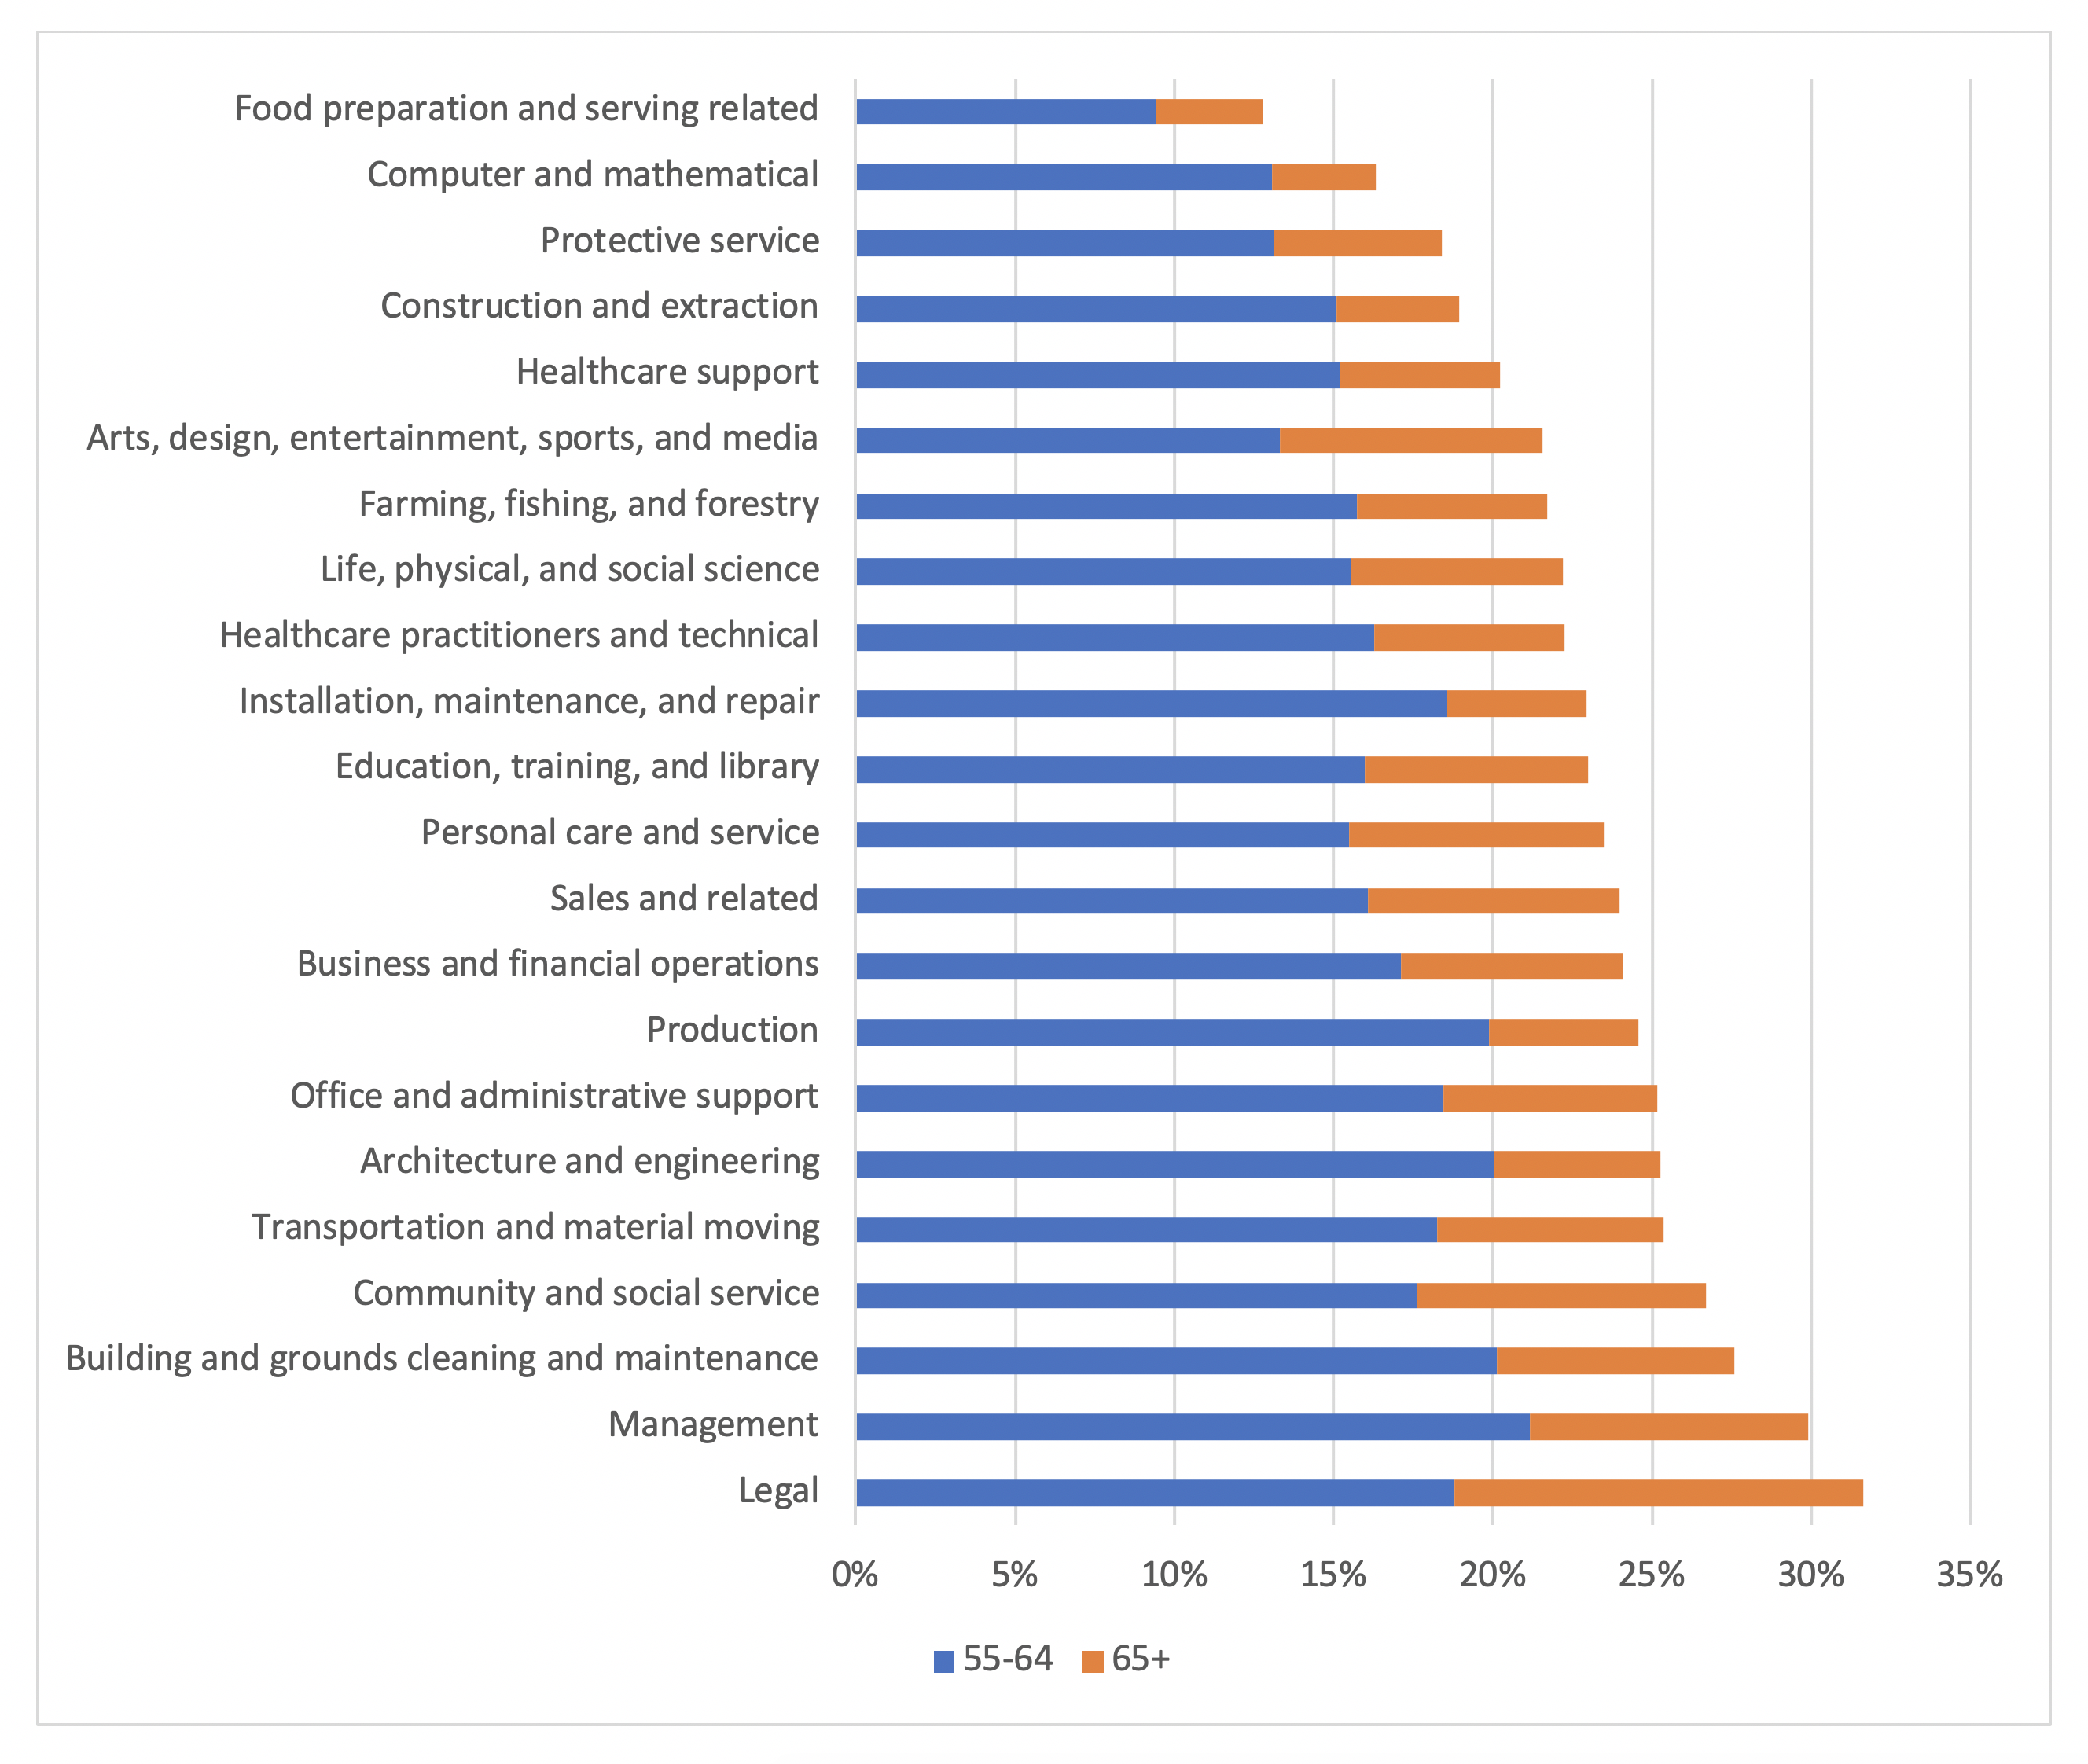
An alternative perspective is to view the age demographics by occupation rather than industry. Chart-3 shows the percentage of the workforce in an at-risk age demographic for a given occupational category taken from the Bureau of Labor & Statistics.
Chart-3: % of Workforce in Age Group by Occupation
As a whole, healthcare practitioners and technical occupations have an at-risk workforce that is slightly below average. These are “frontline” occupations that are the most exposed to the virus and typically cannot be performed remotely. Unfortunately, the sub-category for physicians & surgeons is skewed even higher than the broader healthcare category with 29.2% of the workforce being older than age 55. These healthcare workers are heroically performing their duties even though they are comprised of a largely at-risk demographic.
The two occupational categories with the most at-risk workforce are legal and management. The legal occupation is comprised of some roles that can easily be performed remotely while others might need to adapt to the severe risk posed to workers. Judges, magistrates, & other judicial workers consist of 52.9% ages 55+, while lawyers themselves are 33.2%. Similarly, the management occupation’s ability to perform duties remotely will depend largely on the industry and specific role.
A particularly pertinent topic right now is whether schools should resume with students on campus. Education, training, and library occupations rank relatively average among at-risk demographics. However, the discussion needs to become more nuanced because the at-risk demographics vary by the type of teacher.
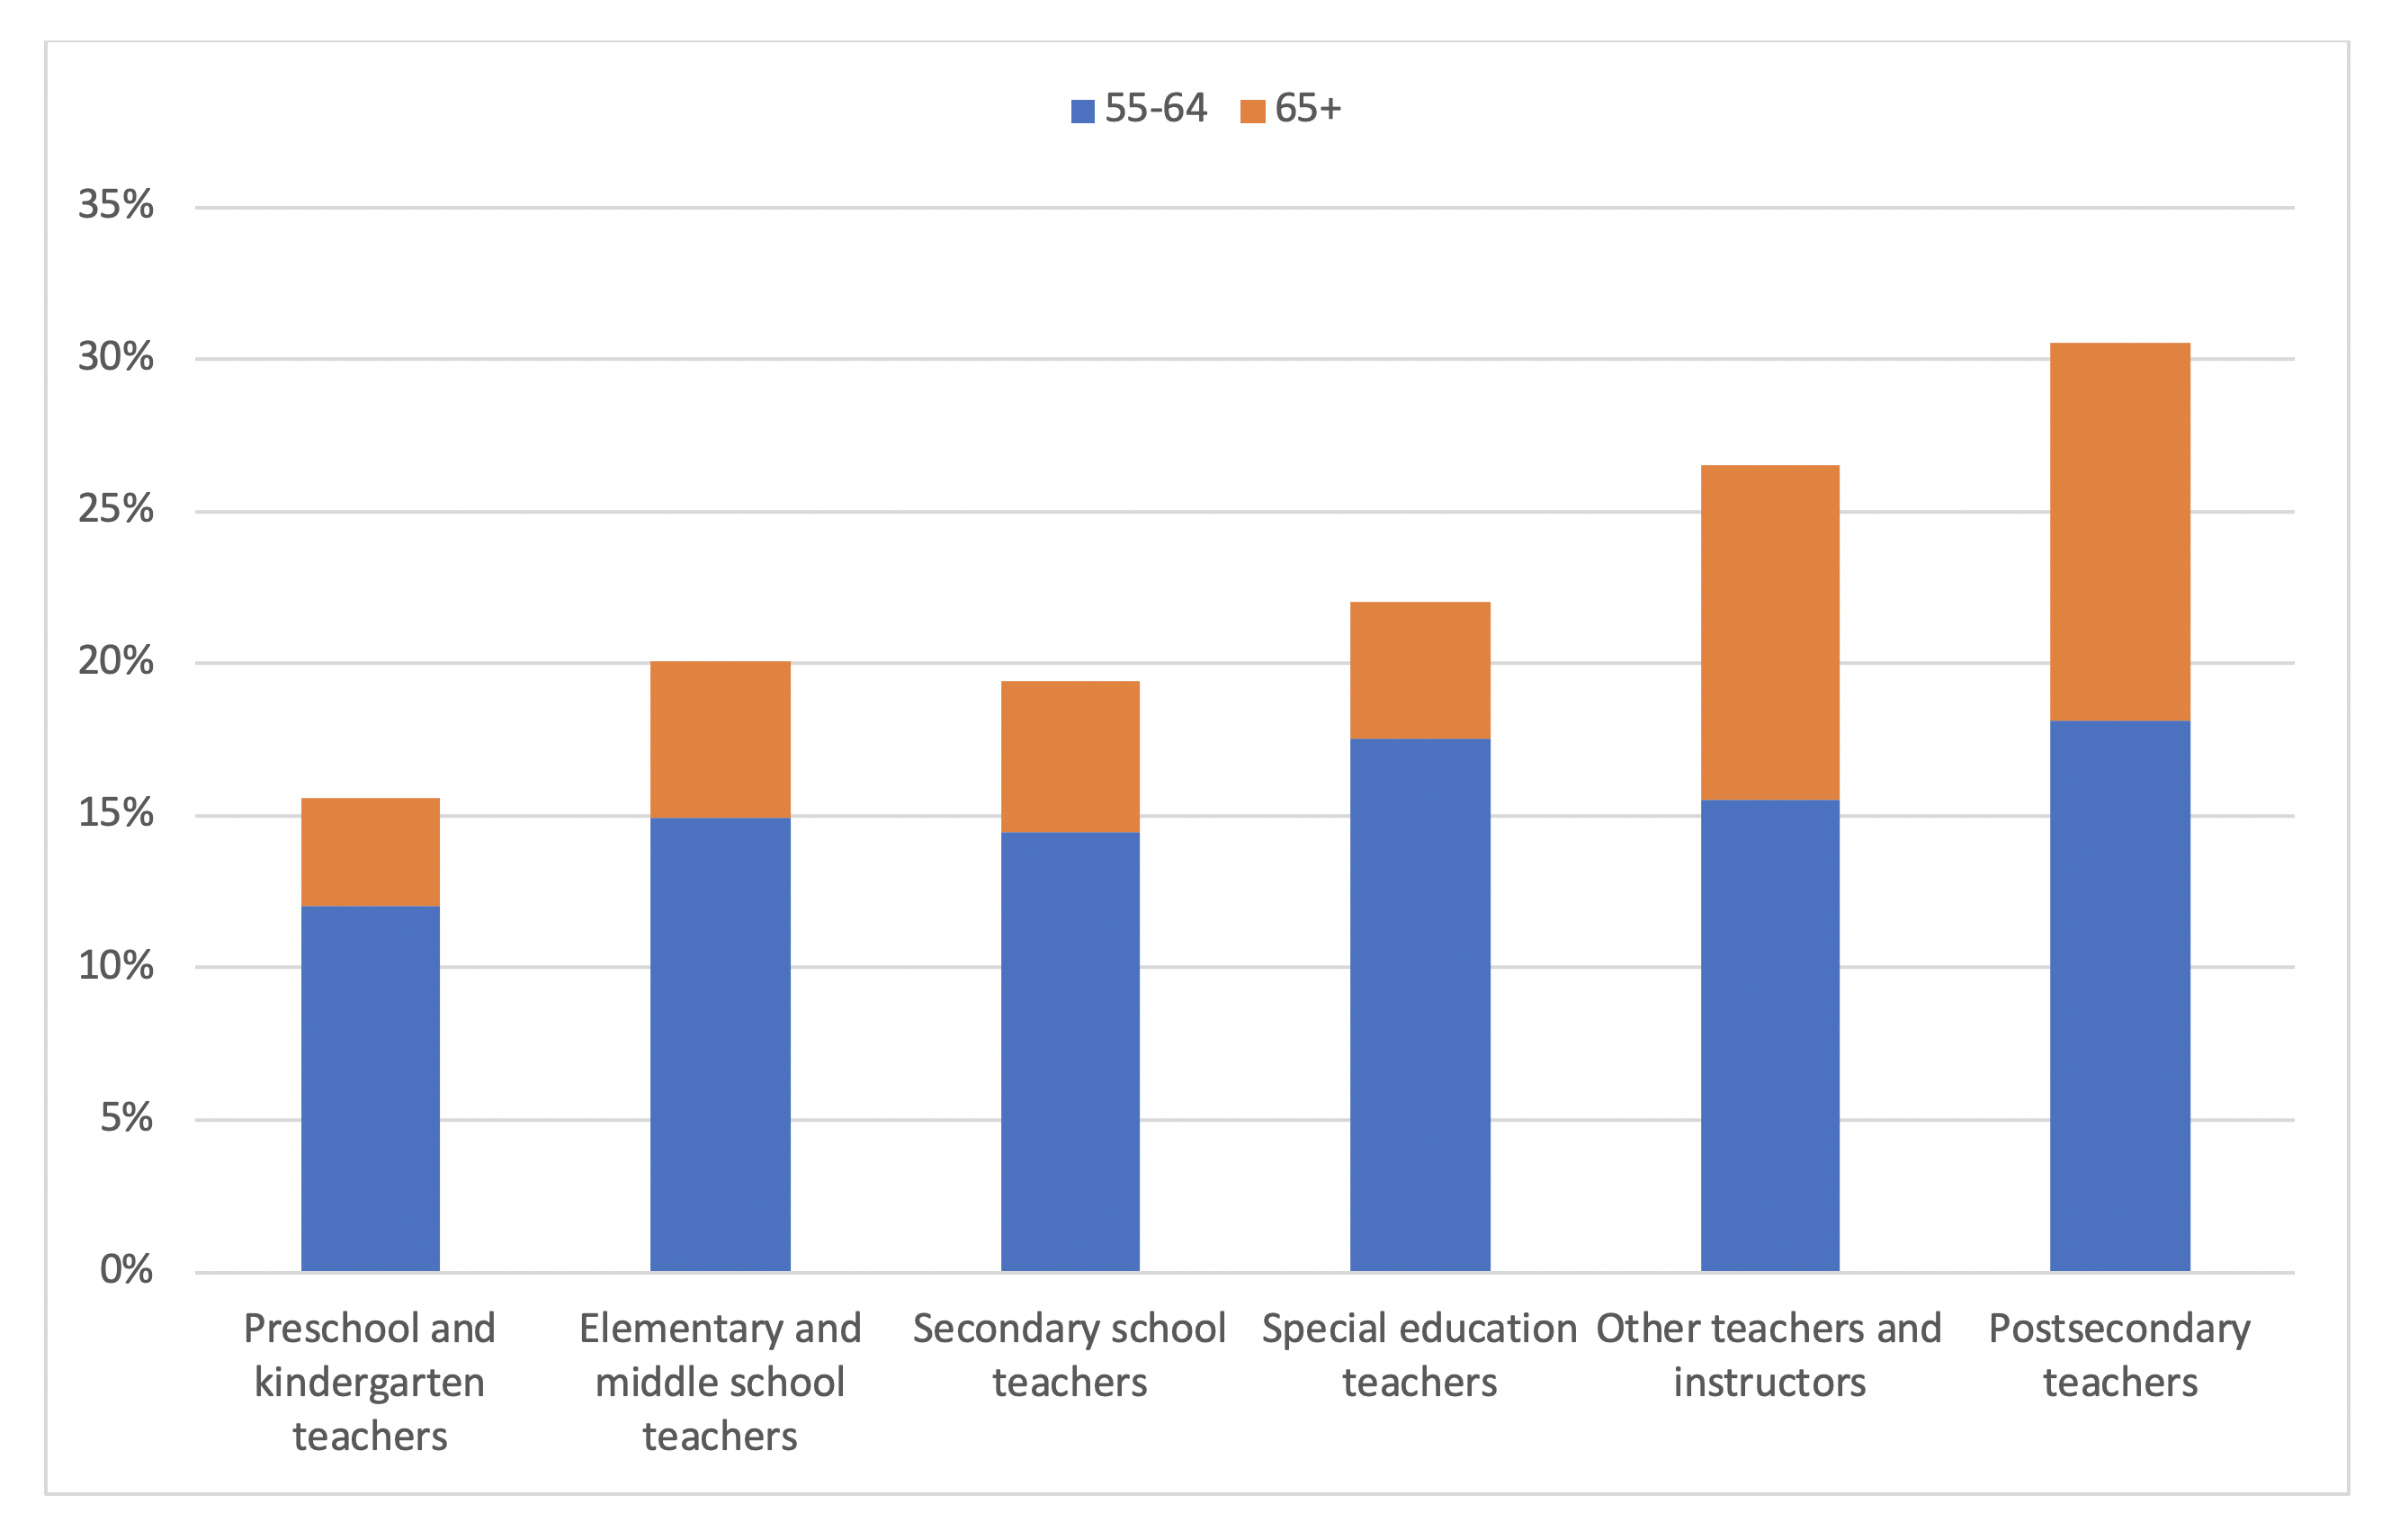
Chart-4: % of Teachers in Age Group
Preschool and kindergarten are comprised nearly entirely of young, healthy teachers who generally are not at risk of death from COVID. Elementary, middle school, and high school teachers also have a relatively low percentage of the workforce that is at-risk, although slightly higher than preschool and kindergarten. On the other hand, postsecondary teachers are significantly older than other teachers and will face significant danger if they are teaching on college campuses where students live amongst each other and easily transmit the virus. A redeeming observation is that the trend in age demographics among types of teacher correlates with the ability for students to learn virtually and without adult supervision. Colleges had been offering or transitioning to online courses long before the pandemic and students typically live independently. On the other hand, virtual education is simply not as effective for preschool and kindergarten students, who also require constant adult supervision. The conversation regarding schooling needs to become more nuanced and particular to the type of student.
Conclusion
There is much more to consider when enacting public policy to reopen the U.S. economy. The data provided in this article is purely descriptive and intended to provide a more granular understanding of how risk is distributed among various industries and occupations. With proper risk identification, we can be better prepared to implement a return-to-work strategy if our vaccine hopes are not realized. This also promotes more effective communication by authorities, rather than generalizing entire industries as “non-essential” even as people’s livelihood depends on the economic value of those industries.
Endnotes
[1] https://www.nytimes.com/interactive/2020/us/coronavirus-nursing-homes.html
[2] It remains to be seen if there are long-term health implications post-infection. A thorough discussion of which demographics are most threatened could span many articles. While younger individuals can be hospitalized or lose their lives to COVID, especially in the presence of underlying conditions, the remainder of this article will take a simplistic approach by considering the “at-risk demographic” ages 55+ with an emphasis on ages 65+. This accounts for 92% of COVID deaths in the United States.
About the Author

Any views or opinions presented in this article are solely those of the author and do not necessarily represent those of the company. AHP accepts no liability for the content of this article, or for the consequences of any actions taken on the basis of the information provided unless that information is subsequently confirmed in writing.


