
In response to a prior article I recently authored, Risk-Based Capital Considerations for Self-Funded Plans, I had a request for a follow-up article focused on stop-loss as a risk mitigation strategy. In an actuarial sense, health care claims be divided into two groups: (a) high-frequency/low-severity, and (b) low-frequency/high-severity (a.k.a., catastrophic claims). The high-frequency/low-severity claims are typically considered to be very stable and predictable across time periods. The low-frequency/high-severity claims, however, are very unstable and unpredictable from year-to-year.
The purpose of stop-loss is to protect against the financial impact that arises due to the volatile nature of the low-frequency/high-severity claims from year-to-year. A particularly bad year (or multiple consecutive bad years) can have an adverse impact on the sustainability of a self-funded medical plan. Rather than accept the full risk associated with the unpredictable nature of catastrophic claimants, the plan may choose to purchase stop-loss coverage from a reinsurance company. This allows the self-funded plan to mitigate the risk of catastrophic claims by transferring the risk to a reinsurer in exchange for a set price the plan can budget for in advance.
However, reinsurance companies are not in the business of giving away money. The reinsurer must price the coverage so there is an expectation to cover claim payouts plus administrative expenses and a profit margin. Because the coverage price includes administrative expenses and profit margin, the net claim expenses for the self-insured plan is expected to be higher with stop-loss coverage than without it. The keyword there is “expected”. Stop-loss is not designed to save the plan money in the long term but rather is designed so the plan can pay a fixed amount of premium on a consistent schedule in exchange for stabilizing the year-to-year financial impact of catastrophic claims.
The impact of large claims on a self-funded group will vary greatly depending on the group size, and because of that, the tolerance to catastrophic claim risk will be unique to each group. The catastrophic claims for a group of 50k members will be much more stable than for a group of 500 members, and thus the 50k group will most likely have higher risk tolerance. Regardless of group size or risk tolerance, I believe every self-funded group should consider their options regarding stop-loss coverage.
Table 1 shows the expected amount of annual catastrophic claims at various attachment points per $1,000 of total expected claims and then shows an estimated stop-loss premium assuming the reinsurer prices for a 60% loss ratio. The attachment point defines the minimum threshold of annual claims per beneficiary to be categorized as a catastrophic claimant. Claim amounts above the attachment point are considered catastrophic claims and are eligible for reimbursement under a stop-loss policy.

As expected, the chart clearly illustrates that the catastrophic portion of expected claim expenses decreases as the attachment point increases. The portion of claims eligible for stop-loss at a $50k attachment point is $191 of total annual claims, sharply decreases to $105 for $100k attachment, then gradually drops until reaching $36 at a $500k attachment.
Assuming the reinsurer’s retention is a percent of the premium, the retention portion follows the same pattern of decreasing sharply as the attachment point increases. The premium for a $50k attachment would include $128 retention, decreases sharply to $70 for a $100k attachment, then gradually drops until reaching $24 for a $500k attachment. From the self-insured group’s perspective, the retention can be thought of as a “surcharge” the group pays to the reinsurer for the benefit of transferring the risk of catastrophic claims to the reinsurer. The substantially higher retention for a lower attachment point disincentivizes the self-funded plan from buying more coverage than needed.
Below are some charts to help illustrate the potential short-term (1-Year) and long-term (10-Years) financial impacts of electing individual stop-loss coverage at various attachment points ($50k, $100k, $150k, $250k, and $500k) and for various group sizes (500, 1k, 2.5k, 5k, 10k, 25k, and 50k beneficiaries). We chose to analyze the impact of stop-loss coverage by comparing it to the 85thand 98thpercent confidence levels. The 85thand 98thpercentiles represent approximately one standard deviation and two standard deviations (respectively) from the expected impact of catastrophic claims. The 85thpercentile may be interpreted as a 15% chance of exceeding the stated amount (or once every 6-7 years), and a 2% chance of exceeding the stated amount (or once every 20 years) for the 98thpercentile. The 85thpercentile is representative of a moderately-adverse scenario whereas the 98thpercentile is representative of a highly-adverse scenario.
1-Year Catastrophic Claim Simulation
Table 2 shows the 85thpercentile of annual catastrophic claims in excess of stop-loss premiums (expressed per $1,000 of total expected claim costs). A positive amount means that catastrophic claims exceeded the premiums and the self-insured plan realized savings with the stop-loss coverage. A negative amount means that the stop-loss reimbursements were lower than the premiums paid by the self-funded group and the group’s costs were higher than they otherwise would have been without the stop-loss coverage.
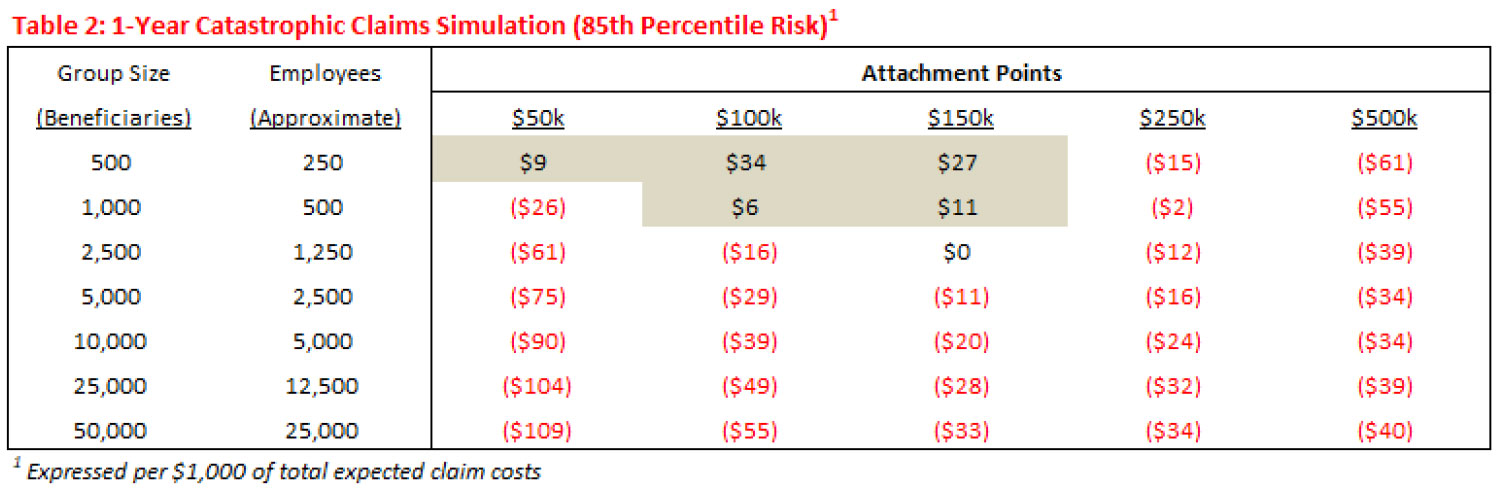
Out of the 35 combinations of group size and attachment point, only 5 combinations realized a cost savings (shaded areas of the table). Group sizes of 500 beneficiaries realized cost savings at the $50k, $100k, and $150k attachment points with corresponding savings of $9, $34, and $27, respectively. Group sizes of 1,000 beneficiaries realized cost savings at the $100k and $150k attachment points with corresponding savings of $6 and $11, respectively. There were no savings for groups with more than 1,000 beneficiaries nor savings for any attachment point greater than $150k. The main takeaway is that even at the 85% confidence level (moderately-adverse scenario), the opportunity to realize reduced costs over a 1-year period is very limited, and in the instance that costs are reduced, the amount of reduction is not substantial.
Table 3 shows the same analysis as Table 2 but for the 98thpercentile of catastrophic claims:
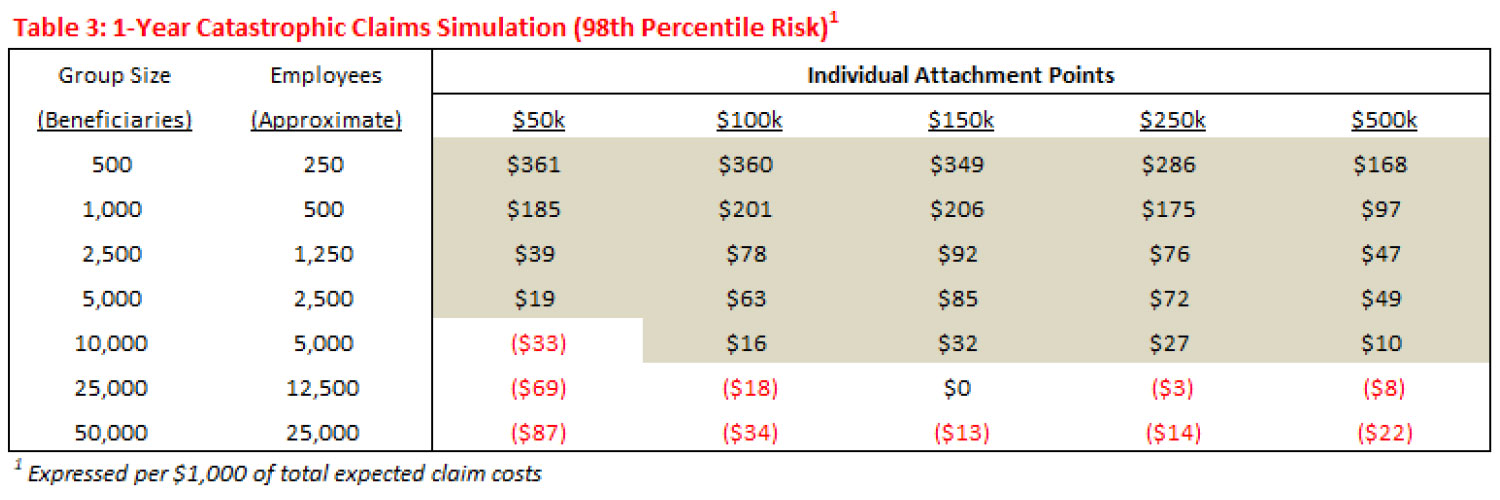
The 98thpercentile tells a much different story than the 85thpercentile. For group sizes between 500 and 5,000 beneficiaries, the self-funded groups realized cost savings at each of the attachment points. Group sizes of 10,000 beneficiaries realized cost savings at all attachment points except $50k. Group sizes greater than 10,000, however, did not realize cost savings at any of the attachment points. The takeaway is that the smaller group sizes have the potential to realize substantial cost reductions over a 1-year period at the 98% confidence level, however, the 98thlevel represents a highly-adverse scenario that is only expected to occur once every 50 years.
10-Year Catastrophic Claim Simulation
Table 4 shows the 85thpercentile of aggregate catastrophic claims in excess of stop-loss premiums over a span of a 10-year period:
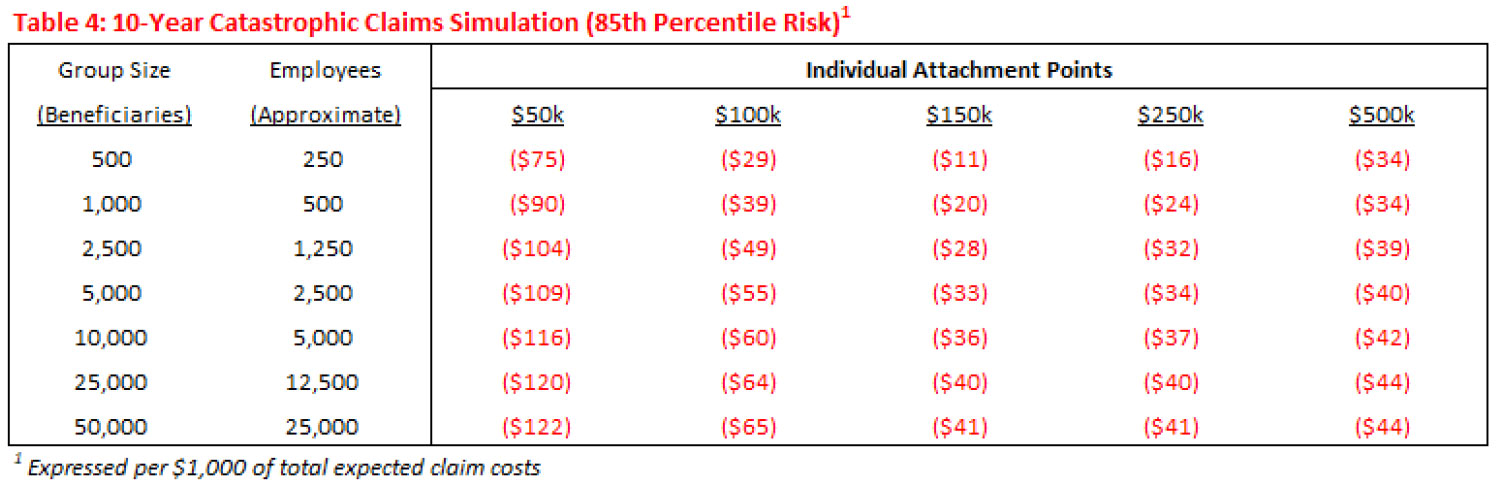
In contrast to the 1-year simulations, there are no realized cost savings for any of the combinations of group size and attachment point at the 85% confidence level. What this means is that over a 10-year period, the experience is expected to smooth-out to a point where there is less than a 15% chance that stop-loss coverage would yield any cost savings no matter the group size or the attachment point. A further analysis (not shown) concluded that even at the 90% confidence level, only group sizes of 500 beneficiaries and a $150k attachment point had realized cost savings, and even then, it was only a modest 0.7% reduction.
Table 5 shows the 98thpercentile of aggregate catastrophic claims in excess of stop-loss premiums over a span of a 10-year period:

Even at the 98% confidence level, only group sizes of 500 and 1,000 beneficiaries would be expected to realize cost savings from stop-loss coverage over a span of 10 years. The takeaway is that even under a highly-adverse scenario, the opportunity to realize reduced costs over the long term is limited to the smaller group sizes.
Now that we have illustrated the opportunity for cost reductions via stop-loss coverage are limited to the smaller group sizes and only under highly adverse scenarios, we will now analyze stop-loss coverage as a mechanism to stabilize claim experience year-over-year. For this exercise, we chose to illustrate the scenario that yielded the most opportunity for cost reduction in the 10-year simulation at the 98% confidence level (i.e., a group size of 500 beneficiaries with $150k stop-loss coverage that resulted in $85 savings).
Table 6 shows simulated claim experience over a 10-year period for a group of 500 beneficiaries with a $150k attachment point under a highly adverse scenario (98% level). Amounts shown are expressed per $1,000 of total expected claims.
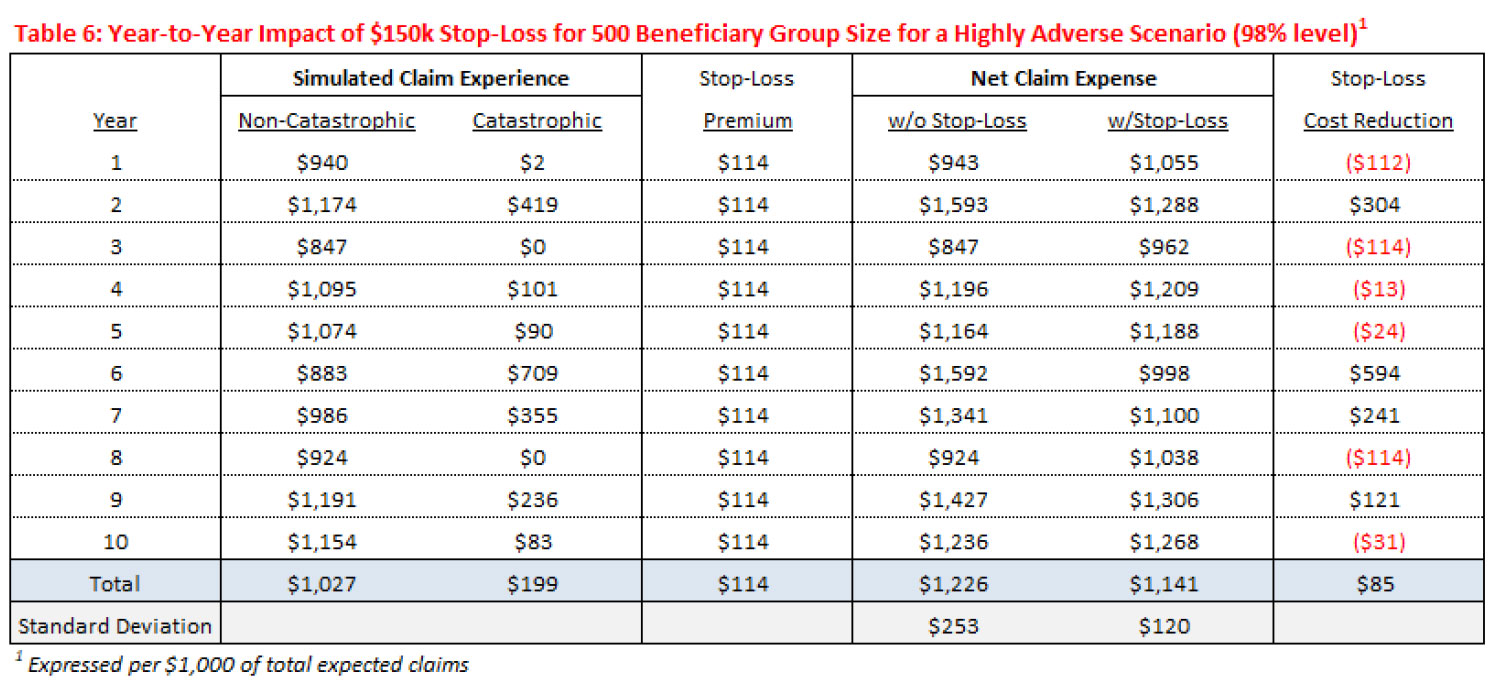
The “Total” row shows that the average reduced costs over the 10-year period are $85 (which matches the corresponding scenario from Table 5) which equates to a 6.9% average annual cost reduction ($85/$1,226).
Years’ #1, #3, and #8 each have minimal catastrophic claims (or none) and the corresponding claim experience is significantly below the annual expected claim levels. In these years, the group pays the stop-loss premiums but gets little to no recoveries, and as a result, the impact of stop-loss coverage has an adverse impact on their net claim expenses. In Years’ #1 and #8 for example, the claim expenses prior to stop-loss are below the expected annual level but above the expected level after accounting for the stop-loss premium.
Years’ #4, #5, and #10 each have catastrophic claim amounts that are close in size to the stop-loss premiums, and therefore the net impact of the stop-loss coverage was only $13-$31 for each year.
The remaining 6 years’ (#2, #6, #7, and #9) each have substantial amounts of catastrophic claims. The latter three years represent 3 out of 4 consecutive years with only #8 having favorable claim experience. Stop-loss coverage has a substantially favorable impact during these four years and reduced costs by $121 in Year #9, $241 in Year #7, $304 in Year #2, and $594 in Year #6. For the 4-year stretch from Year #6 through Year #9, the stop-loss coverage reduced the group’s cost by $210 on average. This 4-year stretch is a great example where stop-loss coverage helps a self-funded group manage their claims costs relative to their budget. Four consecutive years of adverse experience may cause significant financial harm to a group.
The last row on the table labeled “Standard Deviation” is a mathematical statistic that measures the volatility of year-to-year claim experience (i.e., how much does the experience differ from the expectation). The standard deviation prior to stop-loss is $253 which equates to 20.6% ($253/$1,226) of annual claims and $120 after the impact of $150k stop-loss. The impact of stop-loss coverage in this scenario reduced the annual fluctuation by 52.5%. This substantial reduction in standard deviation illustrates that stop-loss is an effective mechanism for stabilizing the annual fluctuations of catastrophic claim experience.
Table 7 shows the same scenario as in Table 6 except under a moderately adverse scenario (85% level). Again, amounts shown are expressed per $1,000 of total expected claims.
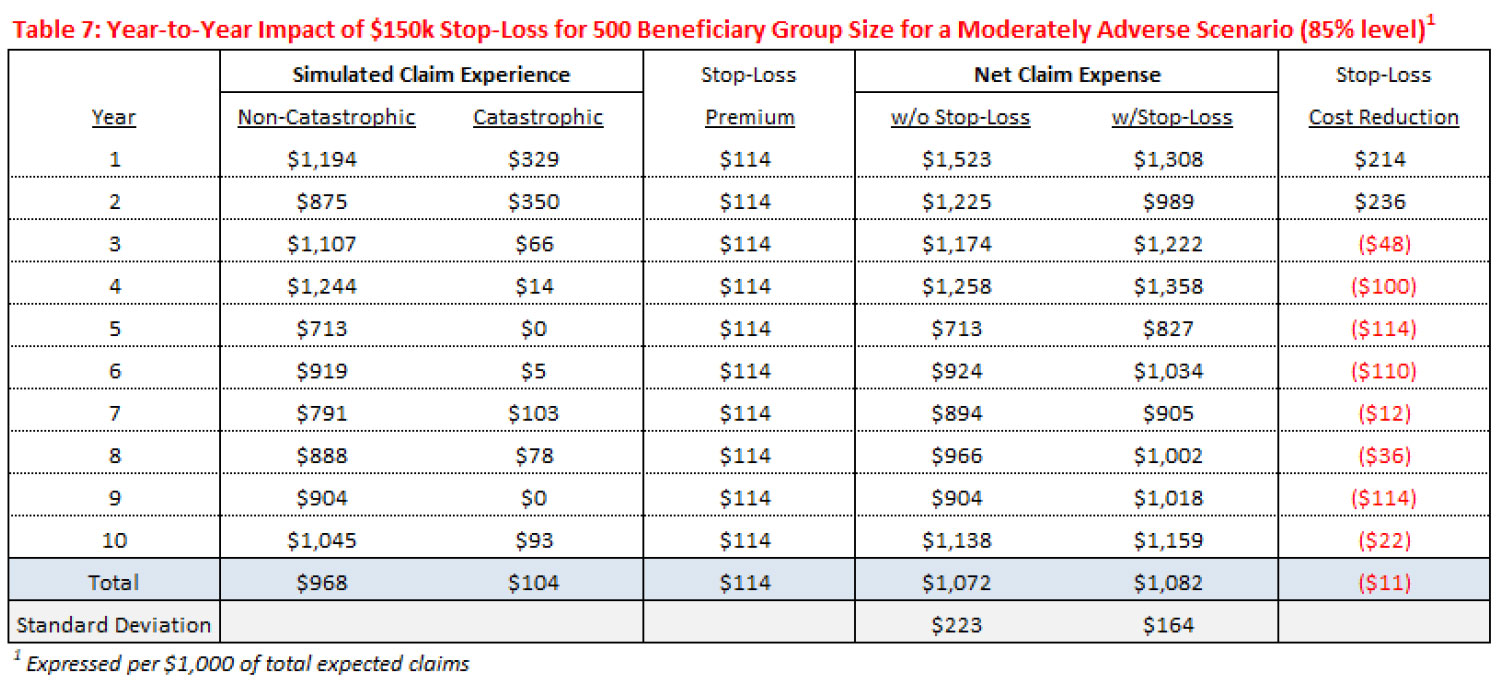
Under the moderately adverse scenario, the stop-loss added an average of 1% ($11/$1,072) expenses per year (costs were reduced in Years’ #1-#2 but increased in Years’ #3-#10), however, there is a substantial reduction in the standard deviation. Without stop-loss, the standard deviation is $223 which equates to 20.8% of annual claims ($223/$1,072). After a $150k stop-loss, the standard deviation is reduced to $164 (26.5% reduction). Even though overall costs increased slightly with stop-loss, there is a substantial reduction in annual catastrophic claim fluctuation. The slight cost increase is a trade-off for a large reduction to the annual claim fluctuation. Each self-insured group will have to decide, based on their risk tolerance and other factors, if the added cost is a worthwhile trade-off in exchange for the added stability to their claim experience.
In conclusion, the above analysis illustrates that stop-loss coverage should not be expected to lower health care expenses for a self-insured group in most scenarios, but it does significantly reduce the volatility of claim expenses caused by catastrophic claims. For a self-insured group that is sensitive to substantial deviations from their annual claim budget, stop-loss is an effective mitigator to protect against the adverse impact of catastrophic claims.
About the Author
Any views or opinions presented in this article are solely those of the author and do not necessarily represent those of the company. AHP accepts no liability for the content of this article, or for the consequences of any actions taken on the basis of the information provided unless that information is subsequently confirmed in writing.