
Two of the main reasons why businesses choose to self-fund their employee health care benefits are (1) to have more flexibility of the plan administration, and (2) to reduce costs. Self-insuring will guarantee cost reduction due to the elimination of certain taxes and regulatory fees (e.g., premium tax). Moreover, businesses that believe fully-insured premiums are highly profit-loaded might expect to see additional cost reduction from self-insuring, given they will no longer be paying profits to an insurer. However, cutting out the insurer’s profit-load will not guarantee reduced costs for the business. Below, we’ll discuss why this is, as well as some crucial steps management should take to make sure they are adequately prepared to switch to a self-funding arrangement for their employee health care plan.
Insurers can typically achieve profits in three ways: (1) loading the premium rates for an explicit profit margin, (2) conservative pricing assumptions (i.e., implicit profit margin), and (3) retaining the underwriting gain when experience is favorable compared to the expectation. However, the insurer is not guaranteed to make profits every year. The insurer takes the risk that the premiums will be sufficient to cover the related claim liabilities, administrative costs, and make provisions for the expected profit margin. There are risks related to rate development errors, underwriting errors, and adverse claim fluctuation (i.e., claims fluctuation risk). Due to the unpredictable nature of health care costs, a pre-determined amount of profit is not guaranteed in any given year. Insurers know it is extremely unlikely that they will achieve their expected profit target every year from each group. Instead, the expectation is that they will achieve their aggregate expected profit margins across the entire line of business (or across multiple lines of business) over the span of multiple years.
When a business decides to self-fund their employee health care, the business bears the risks for the indemnification of the benefit expenses (i.e., insurance risk). Aside exemptions from any taxes or fees, there are no guaranteed cost reductions in any given year when compared to the alternative fully-insured premiums. A self-insured plan may even experience higher cost than a fully-insured arrangement for several consecutive years. In a fully-insured arrangement, the insurer may take a loss on a certain group for several years, but the risk is spread across the entire line of business and gains from other groups help to offset the loss. In a self-funded arrangement, the business bears the entire risk for their annual performance and is not able to spread the risk to other groups to help offset losses.
The NAIC requires that insurance companies hold an adequate amount of assets (i.e., risk-based capital) that is commensurate with the amount of downside risk exposure of their insurance contracts. There are no similar regulations on businesses that self-fund their health care benefits but that does not mean that the same risks are not present. Before deciding if self-funding is the right option for the business, upper management should first (a) be aware that risk exists, (b) become aware of all the potential risks, (c) quantify the potential amount of each individual risk as well as the aggregate risk, and (d) strategically decide how much risk is acceptable to the business. Companies that are larger and historically have had higher profit margins may decide they have a high tolerance to risk whereas companies that are smaller or have thin profit margins may decide their risk tolerance is too low to consider self-funding.
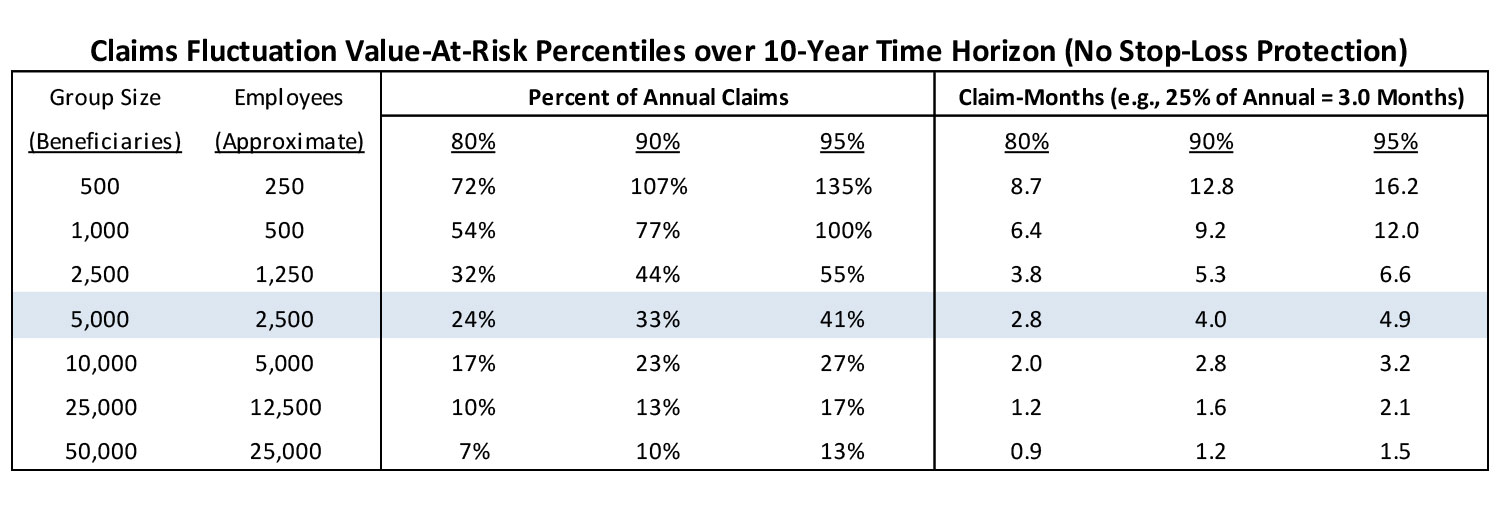
One of the ways that claim fluctuation (i.e., the risk of adverse claim experience) can be quantified is by using the Monte Carlo method to simulate member-level claim costs across multiple years, and then making a comparison to the expected claim cost. The difference between the simulated cost and expected cost is the claim fluctuation risk. Running numerous simulations will result in a distribution of potential claim fluctuation risk. Below is a chart that summarizes the claim fluctuation risk of 1,000 simulated populations over a 10-year period for groups of various sizes, and then quantifies the potential risk at three common confidence levels (80%, 90%, and 95% levels). The results can be interpreted as the amount of funds the company may want to have available (in addition to the annual benefit expense budget) in case they are faced with consecutive years of adverse claims experience. Note that the group sizes are based on beneficiaries rather than employees. I approximate the number of active employees by assuming that most large companies have, on average, one dependent per employee (i.e., beneficiaries = 2 * active employees). Also note that the below chart only quantifies claims fluctuation risk. It does not quantify the additional risks associated with rate development errors, underwriting errors, or any other insurance risks. The totality of all risks that need to be considered are greater than the figures in the chart below.
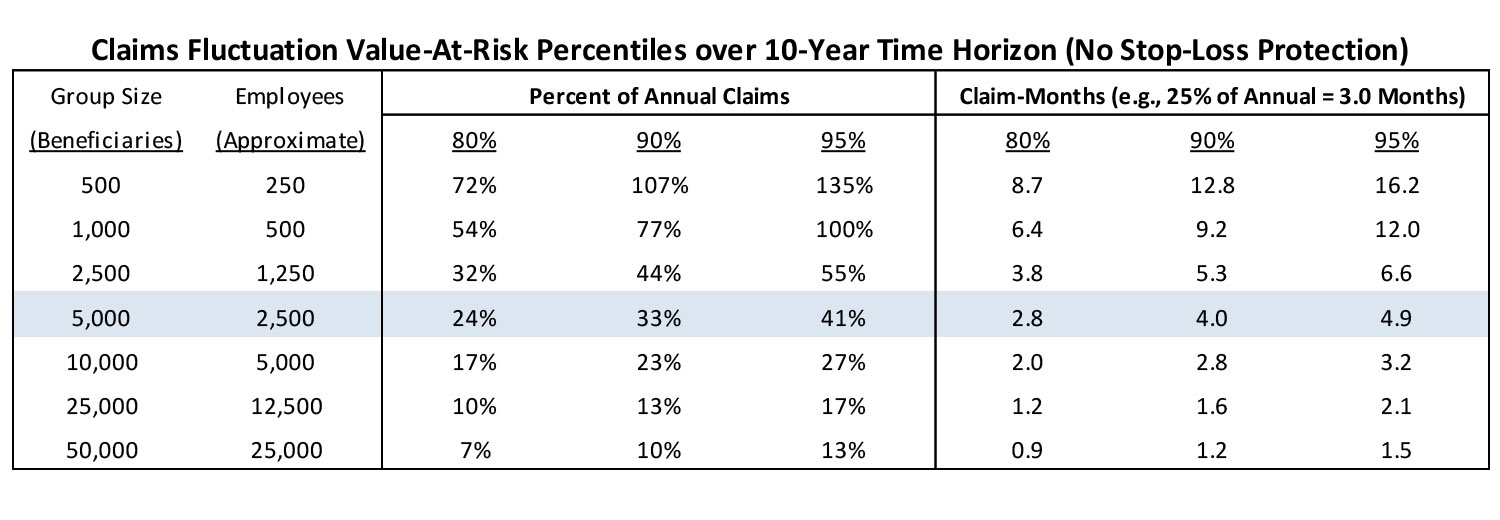
The claims fluctuation risk is expressed as the Percent of Annual Claims and then also converted to Claim-Months(i.e., 12*Annual Percent). The middle row is highlighted because 5,000 members is most commonly considered the standard group size for self-funding (although groups smaller than 5,000 may decide to self-insure and groups larger than 5,000 may decide to stay fully-insured). This group size is used as the middle data point with six alternative (three bigger and three smaller) group sizes used to test the sensitivity of the claim fluctuation risk relative to a group size of 5,000 members.
For a group size of 5,000 beneficiaries (or approximately 2,500 active employees), I would recommend that the business be prepared for claims fluctuation risk equal to about 24%-41% of annual claim cost (or between 2.8 and 4.9 months of claims) with the low end of the range representing 80% confidence (20% change of exceeding that amount) and the high end of the range representing 95% confidence (5% chance of exceed that amount). If the business were to choose the 90% confidence level for their risk tolerance, then the recommendation would be to have about 4 months of claims cost held as a “rainy day” fund. As the group size increases, the aggregate claims become more stable and the risk (expressed as percent of annual claims) gradually decreases. For a group size of 10,000 beneficiaries, the 90% risk tolerance levels would drop to 2.8 months of claims and then drops to approximately 1.6 months for group size of 25,000 and 1.2 months for a group size of 50,000.
However, when the group size decreases, the aggregate claim level loses stability and the risk associated with the same confidence levels increase sharply. The risk for a group size of 2,500 beneficiaries would increase to 5.3 months of claims at the 90% confident level. Group sizes of 1,000 and 500 beneficiaries would increase to 9.2 and 12.8 months (exceeding 1 full year of expected claims!), respectively to maintain the 90% confidence level. Due to the higher claim volatility of groups with 500-1,000 beneficiaries, there may need to be more consideration of using the more conservative 95% confidence level. Deciding on the 95% level would result in a claim fluctuation risk equal to a full year of expected claims for group sizes of 1,000 beneficiaries and over 16 months for group sizes of 500 (before even considering all other risks). With this much potential risk, it would be difficult to justify self-funding unless other mechanisms were in place to help manage or mitigate the risks.
Note that the risk values in the prior chart assumes no stop-loss protection. I would never recommend a self-funded group forgo stop-loss protections. An important consideration with stop-loss coverage is finding the optimal balance between choosing an adequate level of protection (i.e., attachment point) but not having an attachment point so low that the business is ceding away all their expected cost savings in the form of reinsurance premiums.
Shown below is the same chart from above but is accompanied by a second chart that assumes $500k specific stop-loss protection, and a third chart that shows the decrease in claim fluctuation risk associated with the addition of the stop-loss protection.
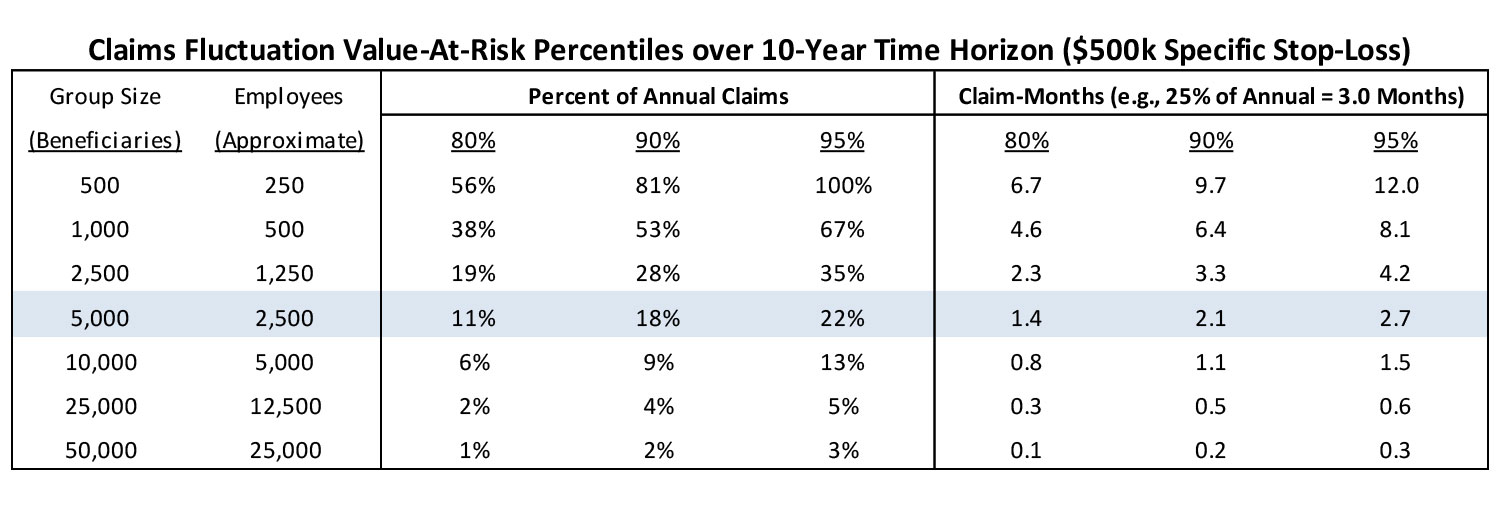
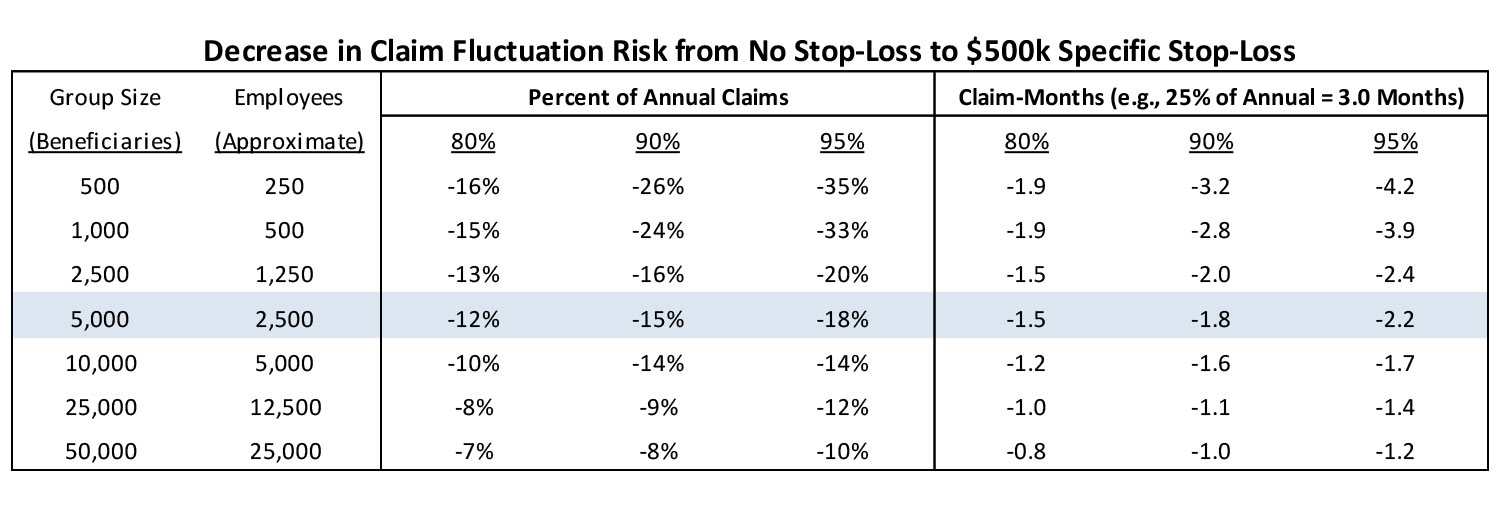
The addition of $500k specific stop-loss has a substantial impact on the claim fluctuation risk. For group sizes of 25,000-50,000 beneficiaries, the risk levels drop substantially below a single month of claims which should provide the assurance that there is a relatively low level of claim fluctuation risk with the addition of $500k specific stop-loss. For group sizes of 2,500-10,000 beneficiaries, there is a 40%-60% reduction of risk, which may have a large influence on the decision whether to fully-insure or self-insure. For group sizes of 500-1,000 beneficiaries, there is a more modest 20%-30% reduction and the risk is still relatively high as a percent of annual claims. To bring the potential risk down to a more manageable level, the smaller group sizes may need to consider a stop-loss arrangement with a lower attachment point (e.g., $100k-$250k) and then decide if the cost associated with the additional stop-loss premium makes it worthwhile to still consider self-funding.
In conclusion, the upper management of any business considering the self-funding of employee health care benefits should be aware of the risks (financial as well as non-financial) involved and then carefully assess their risk tolerance prior to making that decision. Not being aware of the risks and the corresponding quantity of those risks may give the business a false sense of guaranteed cost reductions by transitioning from a fully-insured to a self-funded arrangement.
About the Author

Any views or opinions presented in this article are solely those of the author and do not necessarily represent those of the company. AHP accepts no liability for the content of this article, or for the consequences of any actions taken on the basis of the information provided unless that information is subsequently confirmed in writing.