
Took my family away from my Carolina home
Had dreams about the West and started to roam
Six long months on a dust covered trail
They say heaven’s at the end but so far it’s been hell
And there’s fire on the mountain, lightning in the air
Gold in them hills and it’s waiting for me there
-The Marshall Tucker Band, “Fire On The Mountain”, Spartanburg, SC, 1975
American migration and gold have a long history. People have uprooted and undertaken dangerous expeditions in search of the precious element with hope of ‘striking it rich’. My colleague and I respectively grew up in South Carolina and California. Our independent migrations in search of higher education, career advancement, and fair weather have ultimately led us to the same place. Today, we work together in the Golden State. We have struck gold that we can’t claim, and we are going to tell you where it is. I’m serious. That’s why we wrote this article.
Through our work across the country, we have observed unusual supply distributions and assortments of value assessments assigned to precious metals in the fifty states. In some cases, value distortion has changed market behavior to the extent that reactive responses have led to further distortion and diminished prospector benefits.
A systematic, fair-minded methodology of assessing value is needed for efficient markets; if left alone, all markets will eventually drift toward that equilibrium, but we don’t operate in a realm of that luxury. Transitional misalignment and overpricing will likely be interpreted as market dysfunction, causing suppliers of precious metals to migrate elsewhere and prompting lawmakers unfamiliar with the market mechanics to prematurely stop the gold rush. In the short term, it is incumbent to remove the unnatural barriers that pointlessly constrict market effectiveness. Fortunately, that’s not too hard to do.
ACA Market Barriers
Our references to precious metals are not related to the actual physical metals themselves, but rather to insurance products in Affordable Care Act (ACA) markets with precious metal names loosely denoting their benefit value. We have plainly observed unnatural barriers that constrict market effectiveness in some states to the detriment of its residents. We have shared these prospects with insurers and regulators. Some have enthusiastically received this news and catalyzed action toward a quicker, beneficial market equilibrium. This is reflective in the lower nationwide rates in 2019, and we expect the good prospects to continue in 2020.
Other states and insurers surprisingly aren’t eager to change the status quo. When opportunities to improve markets are presented, the reactions are sometimes narrowly focused and aimed toward survival rather than market optimization. An insurer may say “we’re getting killed at this metal level so we have to…” or “we can’t do that because our competitor is doing this”. Some regulators have expressed contentment and relief just to have insurers participating in the market for another year; they are reluctant to cause disruption, even with changes that would improve markets and make them more attractive for insurers to participate.
We asked ourselves why that is the case, and the answer was readily apparent. While consumers and insurers have recognized that ACA markets have improved tremendously since 2017, many government entities (not all) have been slow to acknowledge this improvement. They still view ACA markets as being in the 2016-2017 era when legitimate concerns of long-term sustainability were raised. Some states still act as if simply retaining insurers in their markets is an annual goal, and maintaining the status quo is a positive outcome.
This approach partially rests on a view that ACA markets are in a stagnant, temporary position until major changes occur at the federal level. The reality is that the “federal solutions” have already occurred; they just haven’t been clearly labeled. It’s now up to states and insurers to make markets thrive.
We realize that mixed messages have been communicated and will continue to be communicated regarding the need for more federal action. While markets have tremendously improved and will improve further with new state opportunities, both sides of the aisle in Washington speak (seemingly more so than when market troubles were more acute) as if an urgent disruption is needed. Despite every measure indicating otherwise, there is little acknowledged public recognition of the market improvements over the last three years. In the runup to a presidential election year, we should expect to hear market problems and their purported corrections exaggerated. This should not distract states and insurers from the current favorable market status and opportunities to enhance markets.
What can states do now? Our analysis clearly indicates that there are significant untapped opportunities across the country that require minimal mining efforts. In some states, this has already occurred. Other states are making appropriate changes in 2020. The remainder of this article will highlight nationwide aberrations and demonstrate how to optimize ACA premiums for maximum efficiency; it will be of interest to both insurers and state regulators, but we should be clear that the ultimate beneficiaries of strengthened, vibrant markets with lower premium costs are ACA consumers.
The prompting of this discussion is a decision executed by President Trump in October 2017. The defunding of cost-sharing reduction (CSR) subsidies and new state flexibility allows ACA markets to thrive, but a nationwide view suggests that few states and their local insurers fully understand the new mechanics. Regardless of the political landscape and the current market dynamics, every state has an opportunity to strike gold. Let us show you how.
ACA Subsidy Mechanics
In May 2014 and December 2015, I explained the implications of ACA premium subsidies. To summarize, the ACA rating rules and subsidy mechanics increased premiums but directionally benefitted low income, older and sicker individuals residing in high cost areas. Expectedly, the variable ACA incentives have attracted a skewed enrollment mix.
After a settling period in 2015 following the initial operational struggles of ACA exchanges, markets were largely in crisis in 2016 and 2017. The markets were not attractive for individuals not receiving premium subsidies, and they were less attractive than expected for those who were. Across the country, states were plagued with large rates increases, insurers exiting markets, and low enrollment (less than half of expected) beginning to shrink.
ACA markets needed a boost, and they got one from what most of us would regard as an unlikely source. While President Trump’s decision to defund CSR payments was based on a legal recommendation from the Department of Justice, it came on the heels of informal discussion that was conveyed via a political bargaining tool rather than a legal basis.
The ACA Life Raft
In August 2017, I explained the beneficial dynamics of defunding the CSR payments, as this had been discussed as a real possibility throughout the year. In October 2017, President Trump defunded CSR payments and the new dynamics were reflected in 2018 in most states. Other states accommodated the change in 2019.
As CSR payments are only applicable for on-exchange Silver plans, the natural actuarial response (matching premiums to risk/benefits) is to reflectively increase premiums for on-exchange Silver plans. Some public discussion of “Silver Loading” has unfortunately regarded this practice as unnatural workaround, prompting discussion of its appropriateness. The only alternatives are obviously problematic, either increasing prices on other benefit plans that had no associated cost increase or not reflecting the necessary adjustment in prices.
While President Trump’s political opponents unsurprisingly decried this decision, some left-leaning advocates understood the math and encouraged the change.
If you are tracking with us so far and had already recognized the beneficial market changes, this is where we are going to surprise some of you. This has already been the source of surprise to some of your regulatory counterparts in other states and other insurance organizations. While almost all state regulators believe that their rates are “Silver Loaded”, the mathematical reality indicates that this is not actually the case. There is room for actuarial judgment here and “Silver Loading” can quantitatively be partially applied, but the overwhelming nationwide evidence is that Silver plans are inexplicably priced more aggressively than other levels, unnecessarily compressing federal subsidies and resulting in higher net premium costs for low-income individuals.
Mathematically, the ramifications of CSR defunding is an increase to Silver premiums relative to other metal levels. As premium subsidies are based on Silver rates, subsidies increase while premium levels for other metal levels are unimpacted. This naturally results in similar non-Silver gross premiums and higher subsidies; this mathematically generates lower net premiums for non-Silver plans.
If Silver premiums are priced too low, this has two negative implications. First, it reduces premium subsidies. Second, it requires premiums on other metal levels to be higher to compensate for artificially low Silver premiums. It’s a fair question to ask why markets would self-sabotage and allow Silver premiums to be too low. We have some thoughts on why that is the case. Admittedly, the general motivation on a nationwide basis is somewhat speculative. The two of us have theorized and debated the rationale at length; we have not debated the unfortunate reality that low Silver rates are restricting market effectiveness across the country.
To measure the appropriateness of Silver premium rates, we simply compare metal level relationships. We don’t consider the overall adequacy of premium rates. It is easy to establish reasonable metal level pricing relationships with known allowable benefit level differences and clear, restrictive ACA rating rules. Outliers are easy to identify. Before we reveal the national summary, it’s useful to first understand the mechanics that lead to striking gold.
Free Gold in the Fields
You’ll forget the sun in his jealous sky
As we walk in fields of gold
Sting – “Fields of Gold”, Wiltshire, England, 1993
Even with an “it might not be your thing” disclaimer, the youthful Canadian audience at the 2017 Guns N’ Roses concert wasn’t quite sure how to react when Glen Campbell’s 1968 Wichita Linemanstarted playing. It was a country song to start with, and one that did not lend itself to easy modification to excite a rock concert crowd, not that the band cared or tried to do so. Jimmy Webb wrote the song with inspiration from a drive across Washita County in western Oklahoma. It’s a simple tale of a solitary telephone repairman working in the vast open plains surrounded by wheat fields. Washita County is one of the largest wheat growing regions in a state known for its fields of gold.
In 2019, ‘fields of gold’ took on an additional meaning in Washita County. Washita is one of the 12 counties (out of 77) in the state where free gold level coverage is available to subsidized ACA enrollees. It is available to anyone willing to migrate, not to the rugged hills of California, but rather in the level wheat fields of Oklahoma. It can be found in the nearby small towns too. A research associate at the Duke University Margolis Center literally suggests that “it’s lying on the sidewalk.”
So how exactly did Oklahoma discover Gold “sooner” than the rest of the country? Many actuaries would correctly offer a one-word answer: math. You probably want more detail, and it’s not too hard to explain.
The following table shows the 2019 gross premiums for Bronze, Silver and Gold plans in Washita County by age. The first highlight is that Gold plans are cheaper than Silver plans for both insurers. This is expected.
| Gross Premium | ||||||
| Metal Level | Issuer Name | Age 21 | Age 30 | Age 40 | Age 50 | Age 60 |
| Bronze | Blue Cross Blue Shield of Oklahoma | $339 | $385 | $433 | $605 | $920 |
| Bronze | Medica Insurance Company | $596 | $676 | $761 | $1,064 | $1,617 |
| Bronze | Medica Insurance Company | $617 | $701 | $789 | $1,102 | $1,675 |
| Silver | Blue Cross Blue Shield of Oklahoma | $524 | $594 | $669 | $935 | $1,421 |
| Silver | Medica Insurance Company | $907 | $1,030 | $1,160 | $1,621 | $2,463 |
| Gold | Blue Cross Blue Shield of Oklahoma | $476 | $541 | $609 | $851 | $1,293 |
| Gold | Medica Insurance Company | $785 | $891 | $1,003 | $1,402 | $2,130 |
With the defunding of the CSR subsidies in 2018, insurers increased (where allowed) their Silver premiums to compensate for the increased benefits received by lower income consumers no longer being reimbursed. Consumers making less than 200% of the Federal Poverty Level (FPL) receive “Platinum level” coverage through “CSR plan designs”, specifically enhanced Silver plans with reduced cost-sharing levels. Silver plan premiums reflect the additional cost by incorporating Platinum level pricing1.
The second lowest Silver premium is used to calculate the subsidy for consumers. Based on income, consumers are assigned a “maximum monthly contribution”. For a person making 350% of the FPL (receiving relatively low subsidy), this is approximately $359. The subsidy received is equal to the cost of the Second Lowest Silver Premium minus the Maximum Contribution. Medica Insurance Company has the second lowest cost Silver premium and the following table shows the subsidy derived from the Medica Silver rates.
| Premium Subsidy Calculation | |||||
| Age 21 | Age 30 | Age 40 | Age 50 | Age 60 | |
| (A) Second Lowest Cost Silver | $907 | $1,030 | $1,160 | $1,621 | $2,463 |
| (B) Maximum Contribution at 350% FPL | $359 | $359 | $359 | $359 | $359 |
| (A) – (B) Calculated Premium Subsidy | $548 | $671 | $800 | $1,261 | $2,103 |
Paradoxically, rising Silver premiums are a boon to the individual market. If Silver premiums are priced as Platinum light plans, all subsidized individual consumers will receive Platinum level subsidies. For consumers making between 200% and 400% of the FPL, many are able to receive free Bronze plans, or free Gold plans in some cases. Net Premiums are equal to Gross Premiums from the first table minus the subsidy shown in the second table. When the Subsidy is greater than the Gross Premium, the Net Premium is $0. As shown in the following table, free gold coverage is available at every age.
| Net Premium | ||||||
| Metal Level | Issuer Name | Age 21 | Age 30 | Age 40 | Age 50 | Age 60 |
| Bronze | Blue Cross Blue Shield of Oklahoma | $0 | $0 | $0 | $0 | $0 |
| Bronze | Medica Insurance Company | $48 | $6 | $0 | $0 | $0 |
| Bronze | Medica Insurance Company | $69 | $30 | $0 | $0 | $0 |
| Silver | Blue Cross Blue Shield of Oklahoma | $0 | $0 | $0 | $0 | $0 |
| Silver | Medica Insurance Company | $359 | $359 | $359 | $359 | $359 |
| Gold | Blue Cross Blue Shield of Oklahoma | $0 | $0 | $0 | $0 | $0 |
| Gold | Medica Insurance Company | $237 | $220 | $203 | $140 | $27 |
Gold Migration
Come on, I’m getting old. Let’s find some gold!
-Moe Fitch, “Fool’s Gold”,Queensland, Australia, 2008
The good news is that free gold is available in Oklahoma in 2019; the better news is it can be in your state in 2020. You don’t have to migrate. It can come to you. In Oklahoma, free gold options are available to all subsidized enrollees in the 12 lucky counties. In 2020, there will be more counties across the country that will likely have free gold options, but they may be limited to the lowest income levels and the oldest ages. It will happen in some states, but not others; the math will clearly explain the state disparities, but the opaque rationale will be a complicated mix of the competitive environment, insurer biases and regulatory focal points.
We should ask “What is preventing the Gold rush across the country?”. A few of the barriers we have noticed in multiple markets are:
- Excessive Silver plan competitiveness (historical & targeted toward CSR beneficiaries)
- Insurers overpricing the Gold to Silver benefit relativity
- Silver loading based on dollars lost as opposed to ‘ACA prescribed’ relativities
- Non-CSR consumers remaining in Silver plans despite the poor value
Premium subsidies have increased across the country, but other states have not seen the Oklahoma dynamic materialize. In most states, non-CSR 87/94 enrollment2 remains at or above 25% and Gold plans still cost significantly more than Silver plans. Allowing insurance companies to load Silver premiums has not been enough to push markets near the equilibrium that maximizes the benefit to consumers. Further consumer education and premium rate review with a specific focus on metal level relativities is the first step to opening markets up to greater affordability. Both are easy steps to take.
Gold to Silver Ratios
The ACA is designed to eliminate rating based on health status. This is true for individual rates; it is true between metal levels as well. The difference between the cost of a Silver plan and a Gold plan should only reflect the benefit relativities between the two cost-sharing levels, prescribed by law to be differences in Actuarial Value (the percentage of overall claims paid by the insurance company) and Induced Demand (level of increased utilization of services due to lower consumer out-of-pocket costs).
Induced Demand has been exaggerated by some insurance companies to inflate Gold and Platinum premiums beyond relative norms. It is widely known that a small portion of enrollees account for a large portion of costs and these enrollees utilize health care services regardless of cost-sharing levels. Induced Demand should therefore have more effect on lower cost decisions impacting a smaller portion of overall costs. Despite this, we have seen 10% increases in Actuarial Value accompanied by 10%-30% increases in induced demand factors; by comparison, the regulatory default is 3%-6% [(1.03/1.00) -1 to (1.15/1.08) -1].
Gold and Platinum plans attract high cost enrollees that should be reimbursed by the Risk Adjustment mechanism of the ACA. Some insurers have calculated Induced Demand factors based on risk-adjusted experience that reflect inadequacies in risk adjustment (and non-uniform coding patterns) rather than benefit relativities. In other words, insurers have introduced experience rating by health status into the Induced Demand factors. The results of these actions reduce the relative Silver premiums, are detrimental to the market, and unnecessarily increase premium costs for consumers.
Based on our analysis of metal levels, we would generally expect the following pricing factors and relationships.3
| Metal Level | Actuarial Value | Induced Demand | Pricing Factor |
| Bronze | 60% | 1.000 | 0.600 |
| Silver | 75% | 1.030 | 0.773 |
| Silver – Enhanced 73 | 75% | 1.030 | 0.773 |
| Silver – Enhanced 87 | 92% | 1.030 | 0.948 |
| Silver – Enhanced 94 | 92% | 1.030 | 0.948 |
| Gold | 83% | 1.080 | 0.896 |
| Platinum | 92% | 1.150 | 1.058 |
The expected Gold to Silver ratio pre-2018 is 1.16 (.896 / .773). Beginning in 2018, roughly 75% of Silver enrollment nationwide is enrolled in either the Silver – Enhanced 87 or Silver – Enhanced 94 plan. The table below shows the expected post-2018 pricing factors assuming both 75% CSR 87/94 and 100% CSR 87/94 enrolment. The latter can be considered the market equilibrium.
| Metal Level | Actuarial Value | Induced Demand | Pricing Factor |
| Bronze | 60% | 1.000 | 0.600 |
| Silver (75% CSR 87/94) | 88% | 1.030 | 0.904 |
| Silver (100% CSR 97/94) | 92% | 1.030 | 0.948 |
| Gold | 83% | 1.080 | 0.896 |
| Platinum | 92% | 1.150 | 1.058 |
Beginning in 2018, the expected Gold to Silver ratio with 75% CSR 87/94 eligible enrollees is .99 (.896 / .904), indicating the appropriateness of Gold premiums at or below Silver premiums. The market equilibrium of 100% indicates a .95 (.896 / .948) Gold to Silver ratio. Accordingly, we would expect Gold to Silver pricing ratios to be in the 95%-99% range as markets move toward equilibrium.
Insurance companies should be allowed to develop their own rating factors consistent with their own business objectives and experience. However, the rates should also be consistent with the ACA and its rating rules. The differences between metal levels should reflect benefit relativities only and not the health status of those enrolling in the metal levels. Rate review should allow flexibility but also develop a cap on induced utilization assumptions to keep premium relativities reasonable and eliminate any experience rating between metal levels. Insurers should independently recognize the aligned benefits of appropriate pricing relationships, particularly those in potential monopoly environments.
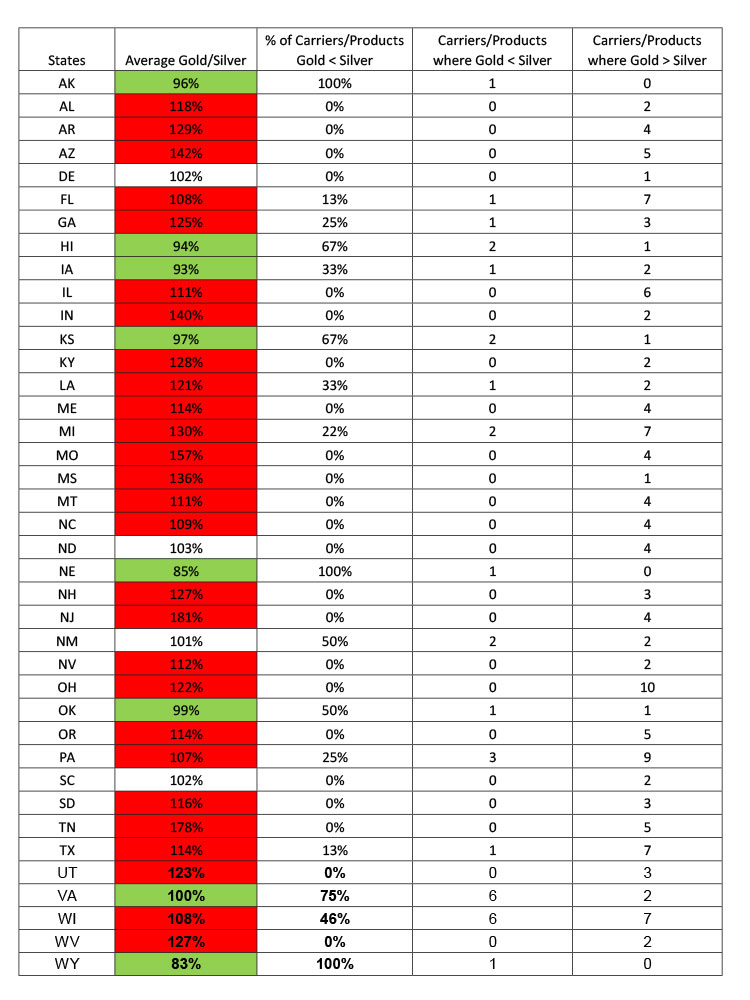
The following table displays the average Gold/Silver ratio in each state and illustrates that many insurers have Gold plans rated below Silver plans in the Federal Exchange states. Green cells indicate states where Gold plans are on average cheaper than Silver plans and red cells indicate states where Gold plans are 5% or more expensive than Silver plans. The lowest rated Silver and Gold plans for a given carrier and product type (PPO/HMO) were used in this analysis. While the ratio may not capture all rating differences, it is a good benchmark in identifying states with the greatest disparities.
Initiating the Gold Rush
For each man who got rich by mining
Perceiving that hundreds grew poor
I made up my mind to try farming
The only pursuit that is sure
-Francis D. Henry “Old Settler’s Song”, Olympia, Washington, 1874
Fortunately, striking gold in ACA markets is a clear pathway that is more similar to harvesting wheat than a risky, speculative venture. The ACA provides insurers a framework to develop (and regulators to review and approve) premium rates that are highly standardized. Actuarial values and Induced Demand pricing factors are strictly permitted to only reflect benefit relativities and not the underlying expected population; this allows regulators to stipulate that metal level slopes are reasonable and conform to allowable differences. The following requirements are four conceptualized ideas to fully leverage the current rules for market and consumer benefit:
- Mandate that insurers price their Silver plans assuming 100% CSR 87/94 enrollment – This would eliminate silver rating inequities between insurers who have different percentages of CSR enrollees. Subsidies would increase and the increased prices will help move non-CSR 87/94 enrollees off Silver where they are currently receiving poor value.
- Mandate that insurers price the Silver load based on benefit relativities as opposed to reimbursing dollar for dollar the cost-sharing reductions – This would eliminate experience rating the Silver Load and force insurers to price Silver rates appropriately in relation to other metal levels.
- Mandate that insurers limit their induced demand differences between metal levels to a maximum of 10% – The HHS differences between metal levels are 3% (1.03/1.00) for Silver to Bronze, 5% (1.08/1.03) for Silver to Gold and 6% (1.15/1.08) for Gold to Platinum. While these ratios are likely good estimates, allowing up to 10% will at the very least eliminate truly outlier pricing ratios. The 10% max would allow for the following induced demand factors: Bronze – 1.000, Silver – 1.100, Gold – 1.210, Platinum – 1.331. Induced Demand factors should also be consistent with small group markets; this is an easy compliance check for both insurers and regulators.
- Allow for automatic re-enrollment into Gold plans for enrollees with incomes above 200% of the FPL –Many non-CSR 87/94 enrollees have remained in Silver plans despite the poor value. Automatic re-enrollment plays a role in enrollees remaining in their Silver plans which can be alleviated if insurers can auto re-enroll members into their lowest Gold plan.

Who Will Strike it Rich?
It is rare that an opportunity arises that benefits most stakeholders. This is one of those rare cases. The beneficiaries of appropriate benefit value assessment are:
- Consumers making under 200% of the FPL –continue to receive Platinum level coverage at no extra cost.
- Consumers making between 200%-400% of the FPL –receive significantly more subsidies and highly subsidized Gold level coverage.
- Consumers making above 400% of the FPL –Increased subsidies leads to increased enrollment which improves the risk of the individual market and lowers gross premiums.
- Insurance Companies –Increased subsidies leads to increased enrollment and favorable market selection. Additionally, instead of consumers selecting Bronze plans, consumers will be more incentivized to choose Gold plans which will further increase revenues.
- State Regulators –fully leverage the current market place rules to bring better coverage at lower premiums to the consumers of their states. Additionally, improved markets will continue to attract more insurers, as they did in 2019.
The following table illustrates savings in each state from appropriately aligning benefit values. Results are calculated using the most populous rating areas in each state, and are based on the average lowest Bronze and Gold Net Premiums paid by 40-year old individuals making 300% of the FPL. We project rating changes to metal slopes that target an appropriate Silver to Gold rating ratio and calculate the impact on Net Premiums for the lowest Bronze and Gold plans available. The Gold highlighted cells indicate states where there is abundant Gold to be mined with over $50 of potential monthly savings available for a 40-year-old consumer making 300% of the FPL.
40-Year-Old, 300% of FPL:
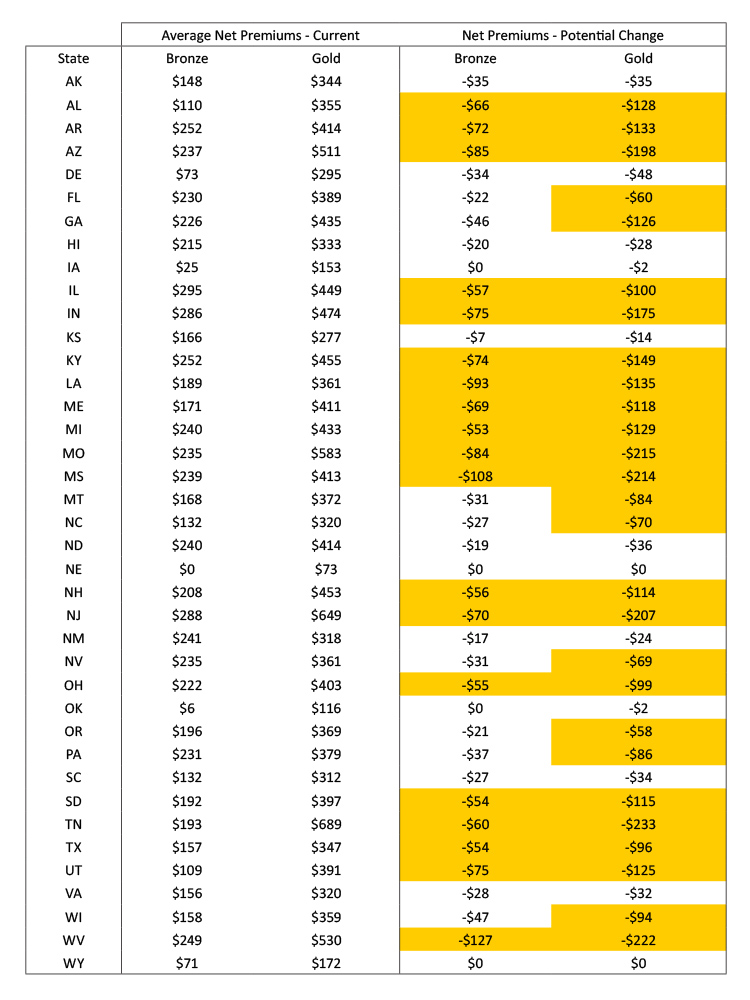
While lacking precision, the results in this table suggest significant opportunity for states to bring increased federal assistance to their low-income consumers that could lower net premiums by over $50. The complexity of ACA rating rules and premium variable necessitates a detailed analysis of each insurer, the networks offered, and the approved actuarial memorandums to provide a more formal assessment.
ACA in the 2020s
I want to live
I want to give
I’ve been a miner for a heart of gold
– Neil Young “Heart of Gold”, Nashville, Tennessee, 1971
The individual marketplace dynamics have changed since 2017. Many stakeholders and market observers don’t fully appreciate the Silver Lining here. ACA markets are in really good shape now. It’s unfortunate that the political climate has muddled a true assessment of market conditions. These messages have undoubtedly confused consumers, and insurers and states should not realistically expect near term assistance from the federal government, either in words or in substance. In other words, it’s all up to you now.
The excellent news is that the federal work is done and allowable benevolence to insurance consumers clearly aligns with the goals of both insurers and state regulators. The only barriers are a proper understanding of the mathematical dynamics and a potentially uneven playing field. In many states, the fields are flat and insurers can reap gold by their own actions alone. In other states, proper regulatory oversight is needed to till the land and produce the harvest. The viability of ACA markets relies on states and insurance companies taking advantage of opportunities to reach a larger segment of the eligible population. While not packaged as such, the federal government has provided a treasure chest of opportunities for insurers and states to improve markets through Section 1332 and CSR defunding.
There’s gold in your state. It’s not limited to the fields of Oklahoma or the mountains of California. It’s mixed in with the purple shadows in Arizona, the peach farms in Georgia, the tidepools in Hawaii, the bluegrass in Kentucky, the aroma of gumbo in Louisiana, the crashing waves in Maine, the blue crab in Maryland, the badlands in South Dakota, the majestic rocks of Utah and all across the fruited plain. You just have to claim it. As plainly as the Marshall Tucker Band said forty-four years ago, “it’s waiting for you there”.
Axene Health Partners, LLC has developed a Market Optimization Model (MOMTM) to measure rate review and premium efficiency in state markets. Please contact Greg Fann at greg.fann@axenehp.com for details.
1 Technically, the pricing is ‘Platinum light’ due to a risk adjustment aberration. Details of this adjustment are beyond the scope of this paper.
2 CSR 87/94 enrollment refers to Silver plan enrollees with incomes less than 200% of FPL who are eligible for ‘Platinum level’ coverage, either a 87% or 94% actuarial value.
2 For simplicity, we have combined Silver – Enhanced 73 and Silver plans, and combined Silver – Enhanced 87 and Silver – Enhanced 93 plans together for the Actuarial Value component of the pricing.
About the Authors

Greg Fann, FSA, FCA, MAAA, is a Consulting Actuary with Axene Health Partners, LLC and is based in AHP’s Temecula, CA office.

Any views or opinions presented in this article are solely those of the author and do not necessarily represent those of the company. AHP accepts no liability for the content of this article, or for the consequences of any actions taken on the basis of the information provided unless that information is subsequently confirmed in writing.