
“Can you tell a green field from a cold steel rail?”
– Wish You Were Here, by Pink Floyd
When a colleague and I wrote Fields of Gold in April last year, the imagery seemed perfect. The Gold Rush of 1849 led many prospectors to California; the “Golden State” has also been the most visible to enact measures promoting the Affordable Care Act (ACA) markets. However, it was twelve counties in rural Oklahoma that “discovered” free gold-level coverage for every subsidized enrollee sooner (pun intended) than anyone else. On the great plains, gold is associated with sparkling wheat fields rather than precious metals, hence the title and the inspiration to alert other states that they could also accomplish Oklahoma’s feat. The prospect of signaling an opportunity to dramatically improve challenged ‘markets of last resort’ by simply applying a “systematic, fair-minded methodology of assessing value” was encouraging and gratifying for both of us.
Fast-forward six months to an awaited review of 2020 premiums and I am discouraged and thinking of darker imagery. Much of the country was not “walking through Fields of Gold” (near fair value equilibrium pricing after Cost-Sharing Reduction [CSR] defunding and gold prices below silver) and my first thought was to continue the prairie symbolism with a drought-induced dust bowl signaling hard times in the cultivable fields. On the other hand, the impression of unfortunate environmental conditions suggests circumstances largely beyond our control, and a more representative field image of current ACA markets is a collective disinclination to distinguish free-flowing tall grass from fixed steel objects that are unaffected by blowing winds.
Meaningless Field Measures
The limelight of reliance upon misconstrued ACA measures occurred when 2020 market premiums were publicly released. A 4% average reduction in benchmark premium rates was widely portrayed as a positive development, but that was from a traditionalist health insurance viewpoint and not aligned with the real impact on ACA consumers.
To appreciate the context, it is important to note 75% of the ACA individual market and almost 90% of exchange enrollees receive premium subsidies, and the distribution of subsidized enrollees increases every year. As premiums are based primarily on the experience of subsidized enrollees, markets benefit from lower subsidized premiums, which in turn attracts a healthier market leading to lower non-benchmark premiums for unsubsidized enrollees. Therefore, an appropriate understanding of the health of ACA markets is focused on their market attractiveness to lower-income subsidized enrollees rather than the gross level of benchmark premiums.
The minority of enrollees who are unsubsidized should not be concerned with benchmark premium rates either; all silver plans are necessarily overpriced relative to the benefits unsubsidized enrollees receive to accommodate benefits for CSR enrollees; accordingly, unsubsidized enrollees should never select an ACA exchange benchmark plan.
The benchmark plan in ACA markets is simply a fixed rail that determines premium subsidies. It does not determine how much consumers pay for a benchmark plan; it inversely determines how much consumers pay for other plans. Regardless of the benchmark plan premium, a subsidized enrollee pays the same amount to enroll in that plan, a fixed percentage of his/her income. So why do we annually report benchmark rates as an indication of consumer impact? Why is the camera focus on a cold, steel rail rather than fields of free-flowing plan rates scattered throughout the marketplace? The net premium that consumers pay shifts as the cost of the plans they purchase varies from the benchmark premium; the benchmark plan premium simply determines the government subsidy.
The Math Part
“Don’t trust your gut on this one, the media, or President Trump. Trust math.”
– DJ Wilson, “Six steps to understanding the significant benefits of Trump’s CSR system”
While the premium mechanics are somewhat familiar to ACA stakeholders, some numerical examples more clearly demonstrate the premium dynamics. Gross premiums and net premiums for two individual adults are illustrated in the tables below. Figure 1 displays the gross monthly premiums for two sample companies, Angelfish and Bluefish, offering Bronze, Silver, and Gold plans.
Figure 2 illustrates the subsidy calculation for a specific income level and age. This is determined by calculating the maximum monthly contribution that an enrollee pays for the benchmark plan (2nd lowest-cost silver, Bluefish Silver in this case) Assuming the maximum contribution percentage of 7.50 percent for an individual with an income of $48,000 (a reasonable approximation but not representative of any year), the maximum monthly contribution for that individual is $300 [$48,000 * 7.50% / 12]. The calculated premium subsidy is the gross monthly premium of the benchmark plan minus the $300 maximum dollar contribution from the enrollee.
Figure 3 illustrates the net monthly premiums that enrollees pay for each plan in the market after subtracting the premium subsidy from the gross monthly premiums.
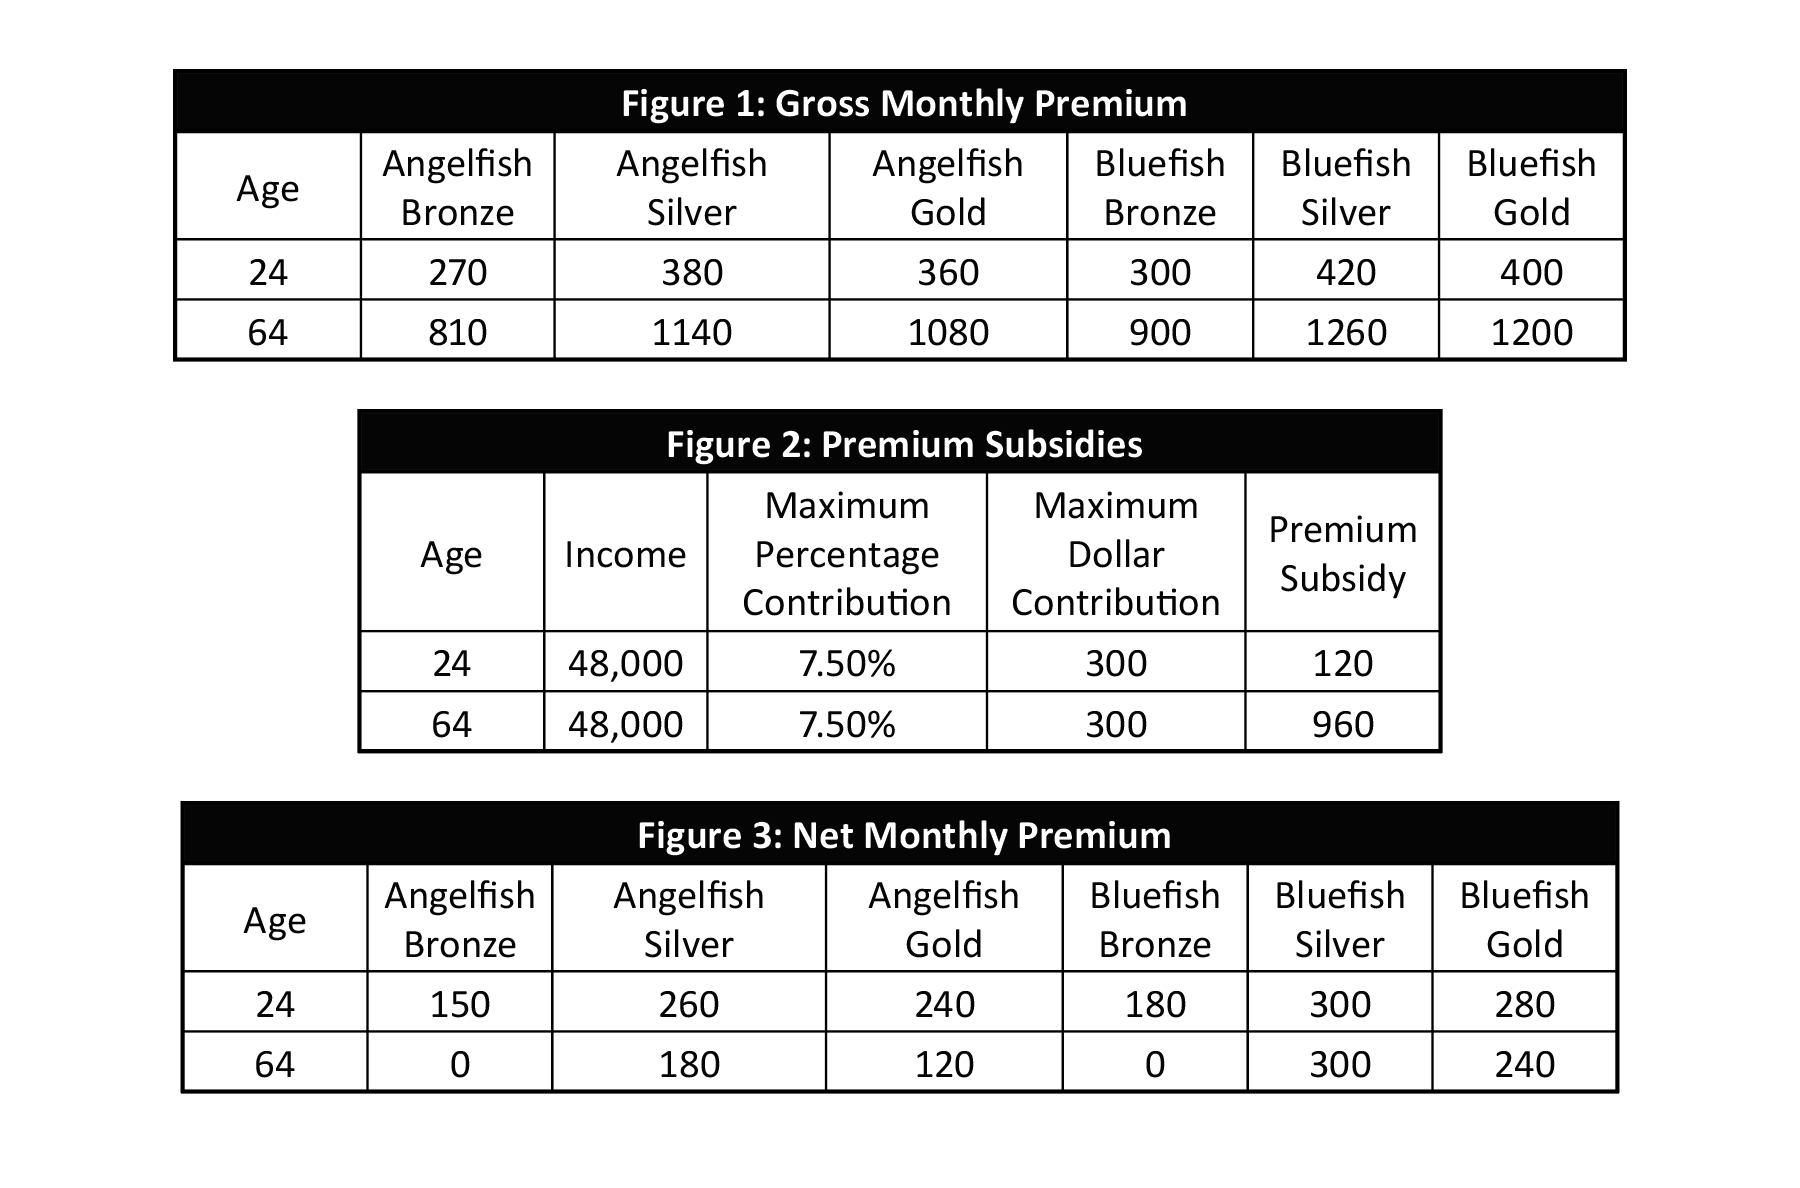
Figure 4 illustrates the gross monthly premiums after a 4% silver premium (including benchmark plan) decrease. The silver premium values in Figure 4 are 4% lower than the values in Figure 1.
Figure 5 illustrates the subsidy calculation. The premium subsidy is lower because the benchmark plan (Bluefish Silver) premium is lower. The maximum contribution of $300 does not change.
Figure 6 illustrates the resulting net monthly premiums, reflecting both the lower silver gross premiums and the lower premium subsidy. It should be noted that net benchmark premiums are $300, no change from Figure 3, while net premiums are higher on all other plans.
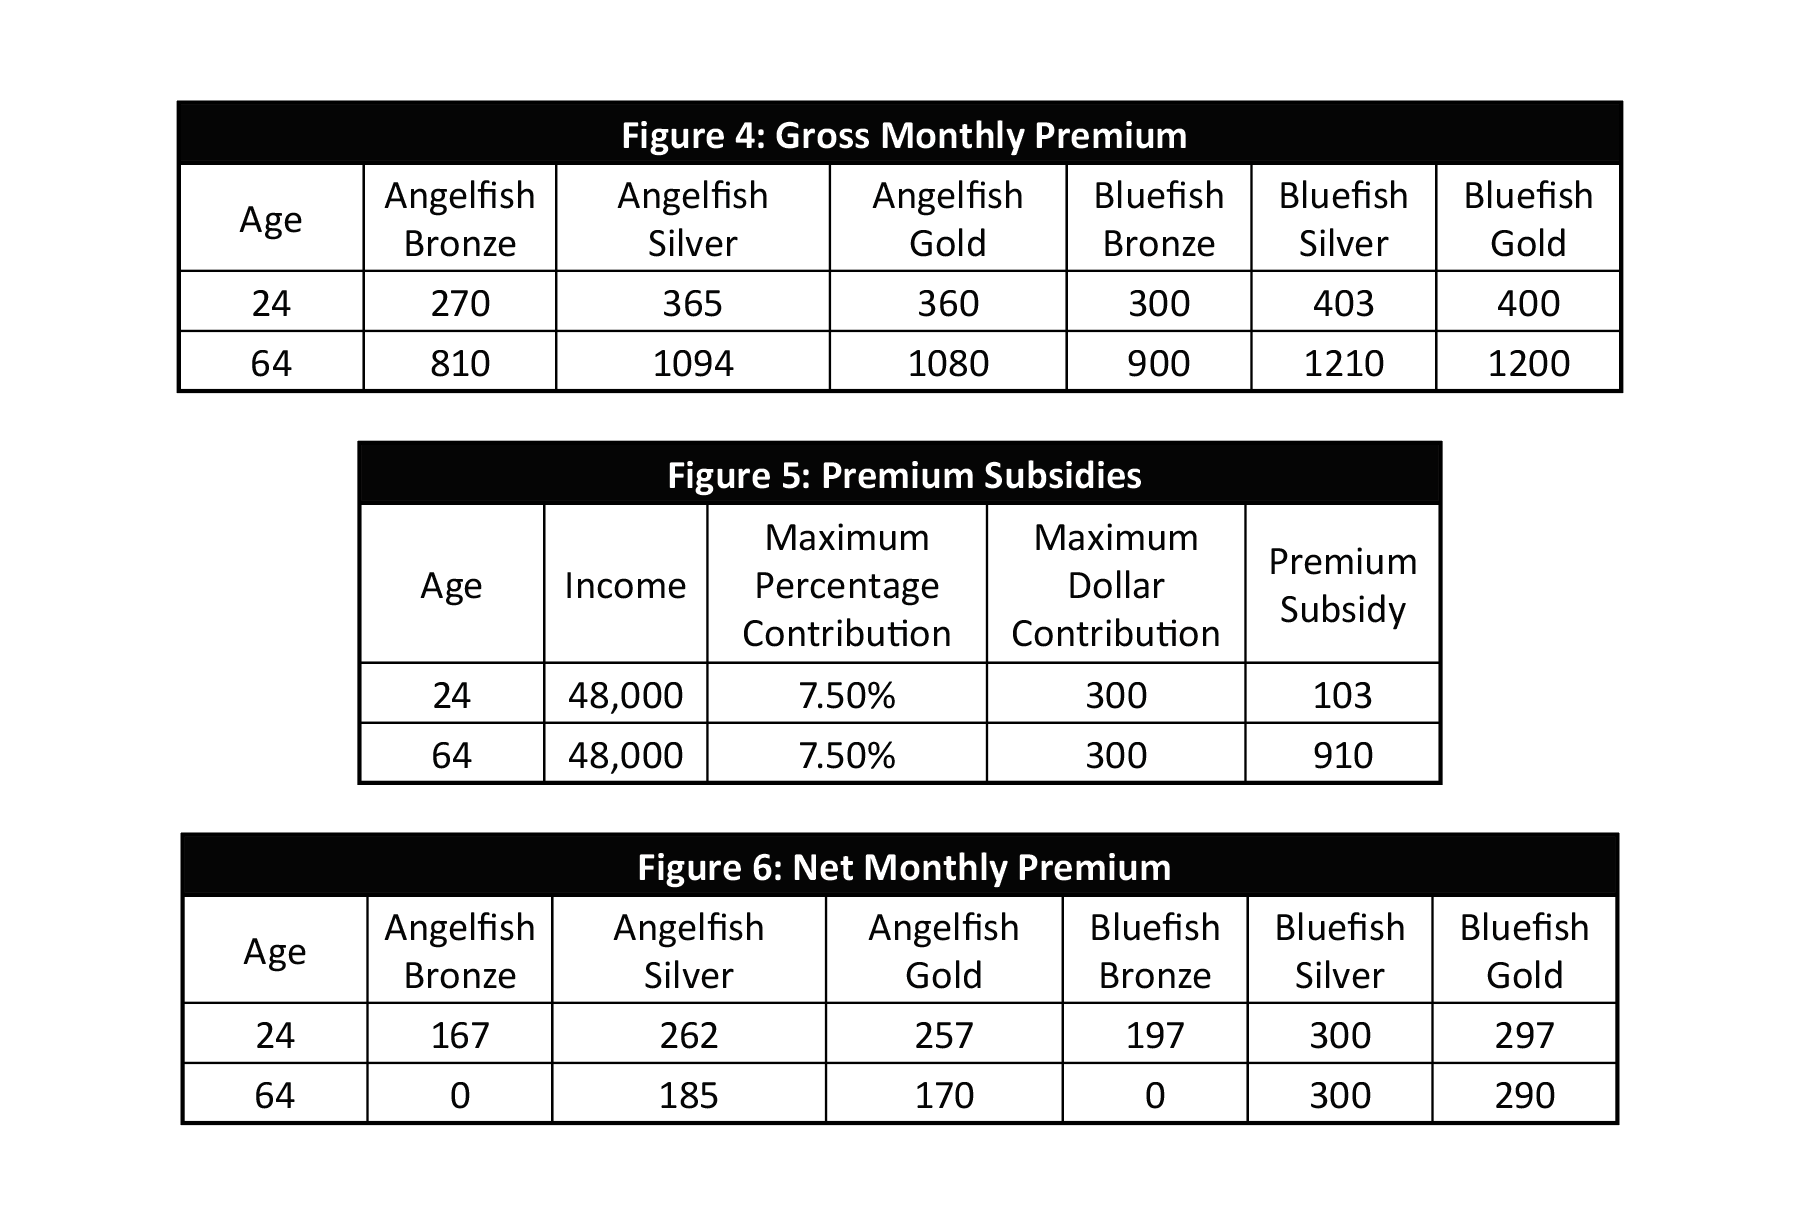
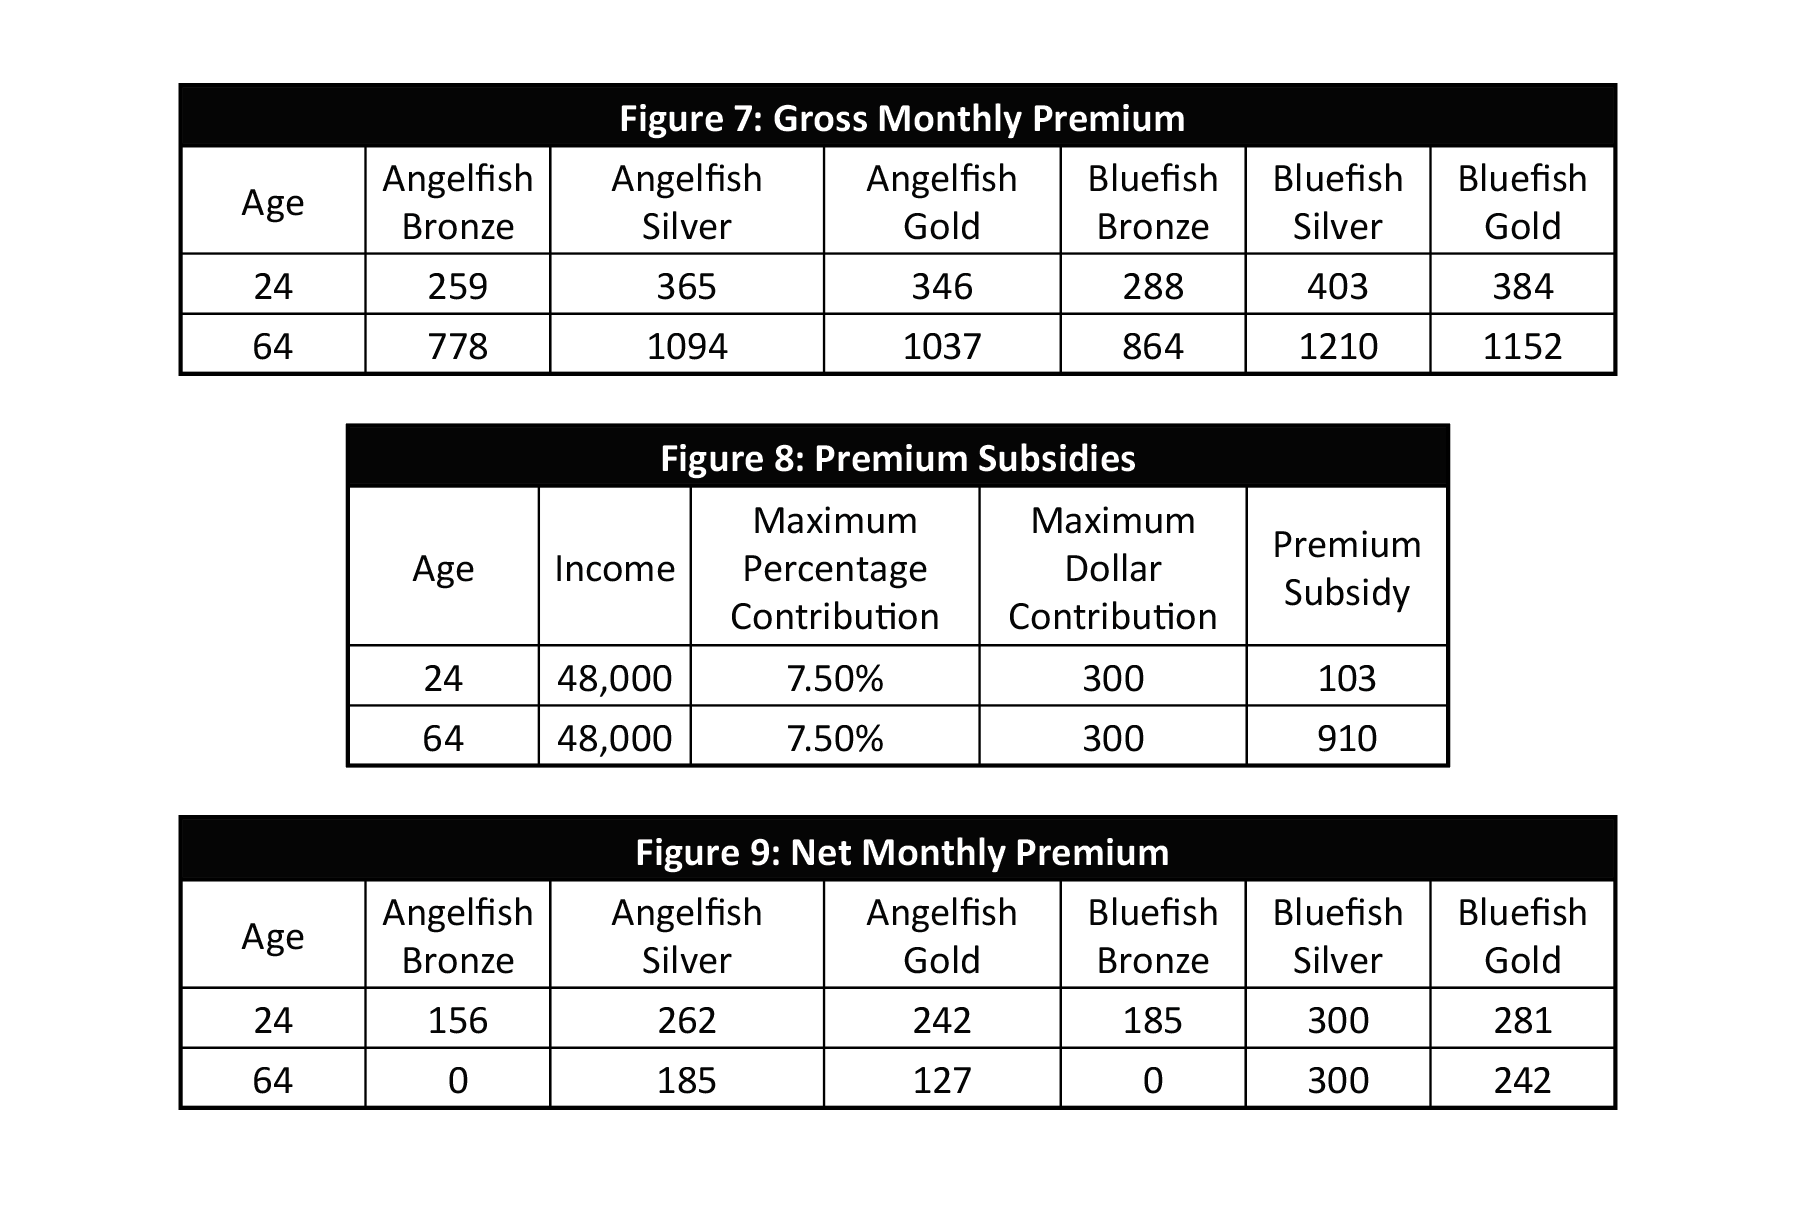
Figure 7 illustrates the gross monthly premiums in a different scenario, a 4% gross premium decrease for all plans.
Figure 8 illustrates the subsidy calculation. The premium subsidy is lower because the benchmark plan (Bluefish Silver) premium is lower. The maximum contribution of $300 does not change.
Figure 9 illustrates the resulting net monthly premiums, reflecting both the lower gross premiums and the lower premium subsidy. As expected, net premiums for non-benchmark plans are lower than values in Figure 6 as gross premiums dropped. More insightful, net premiums are higher than they were in Figure 3; a premium decrease across the board increases net premiums. One caveat here is that the opposite would be true for plans priced above the benchmark plan, but those plans attract very few enrollees.
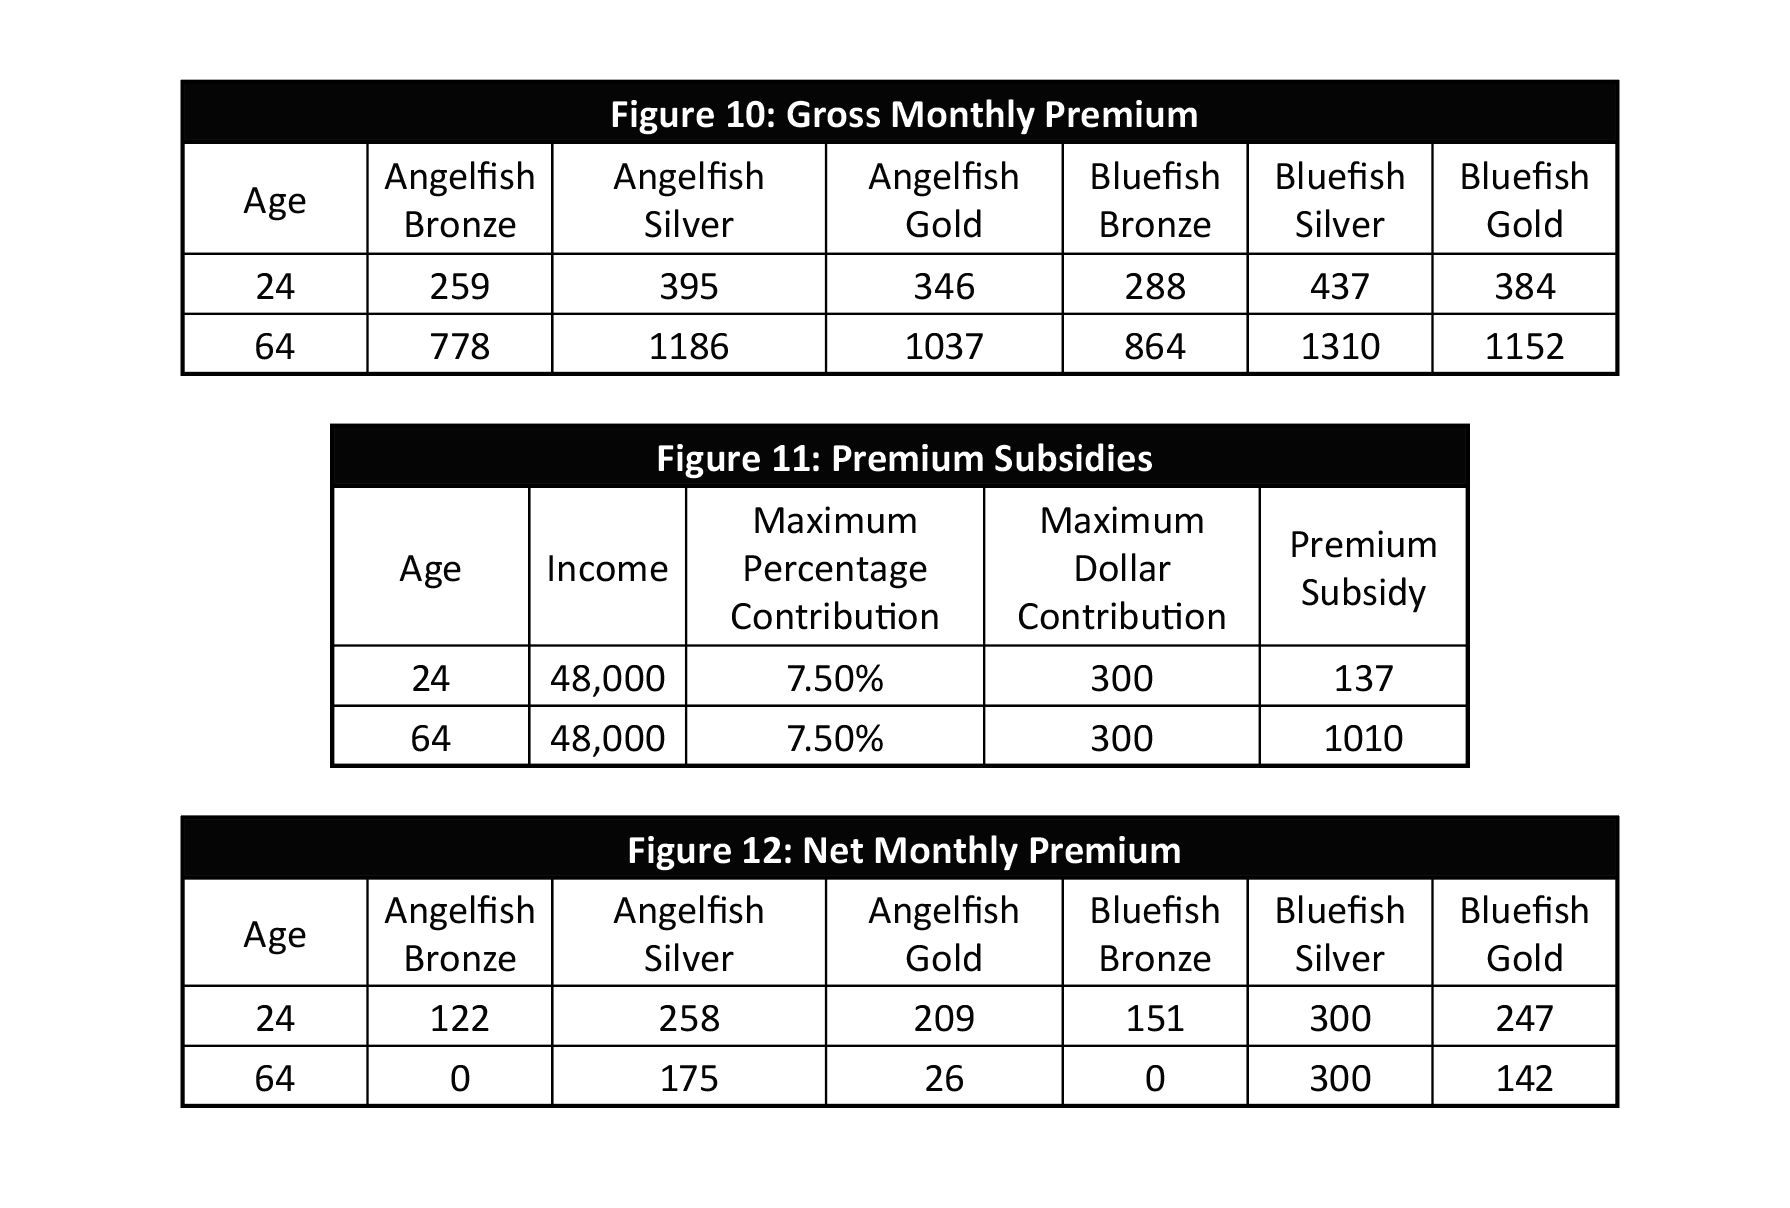
Finally, Figure 10 illustrates the gross monthly premiums after a 4% gross premium increase for silver plans and a 4% gross premium decrease for other plans. Silver premium plan increases in the favorable scenario, and notwithstanding the aberration of 2019 and 2020 premiums decisions, this should be expected each year. Until states reach market equilibrium, silver plan premium rates should grow at a faster rate than other plans. The Congressional Budget Office says, “After 2018, growth in gross premiums is projected to be slightly slower for bronze than for silver plans …Such growth for gold plans is projected to be slower than for silver or bronze plans…The fast premium growth of silver plans is projected to make those plans increasingly unattractive over time to people not eligible for subsidies.”
Figure 11 illustrates the subsidy calculation. The premium subsidy is lower because the benchmark plan (Bluefish Silver) premium is lower. The maximum contribution of $300 does not change.
Figure 12 illustrates the resulting net monthly premiums, reflecting both the lower gross premiums and the higher premium subsidy.
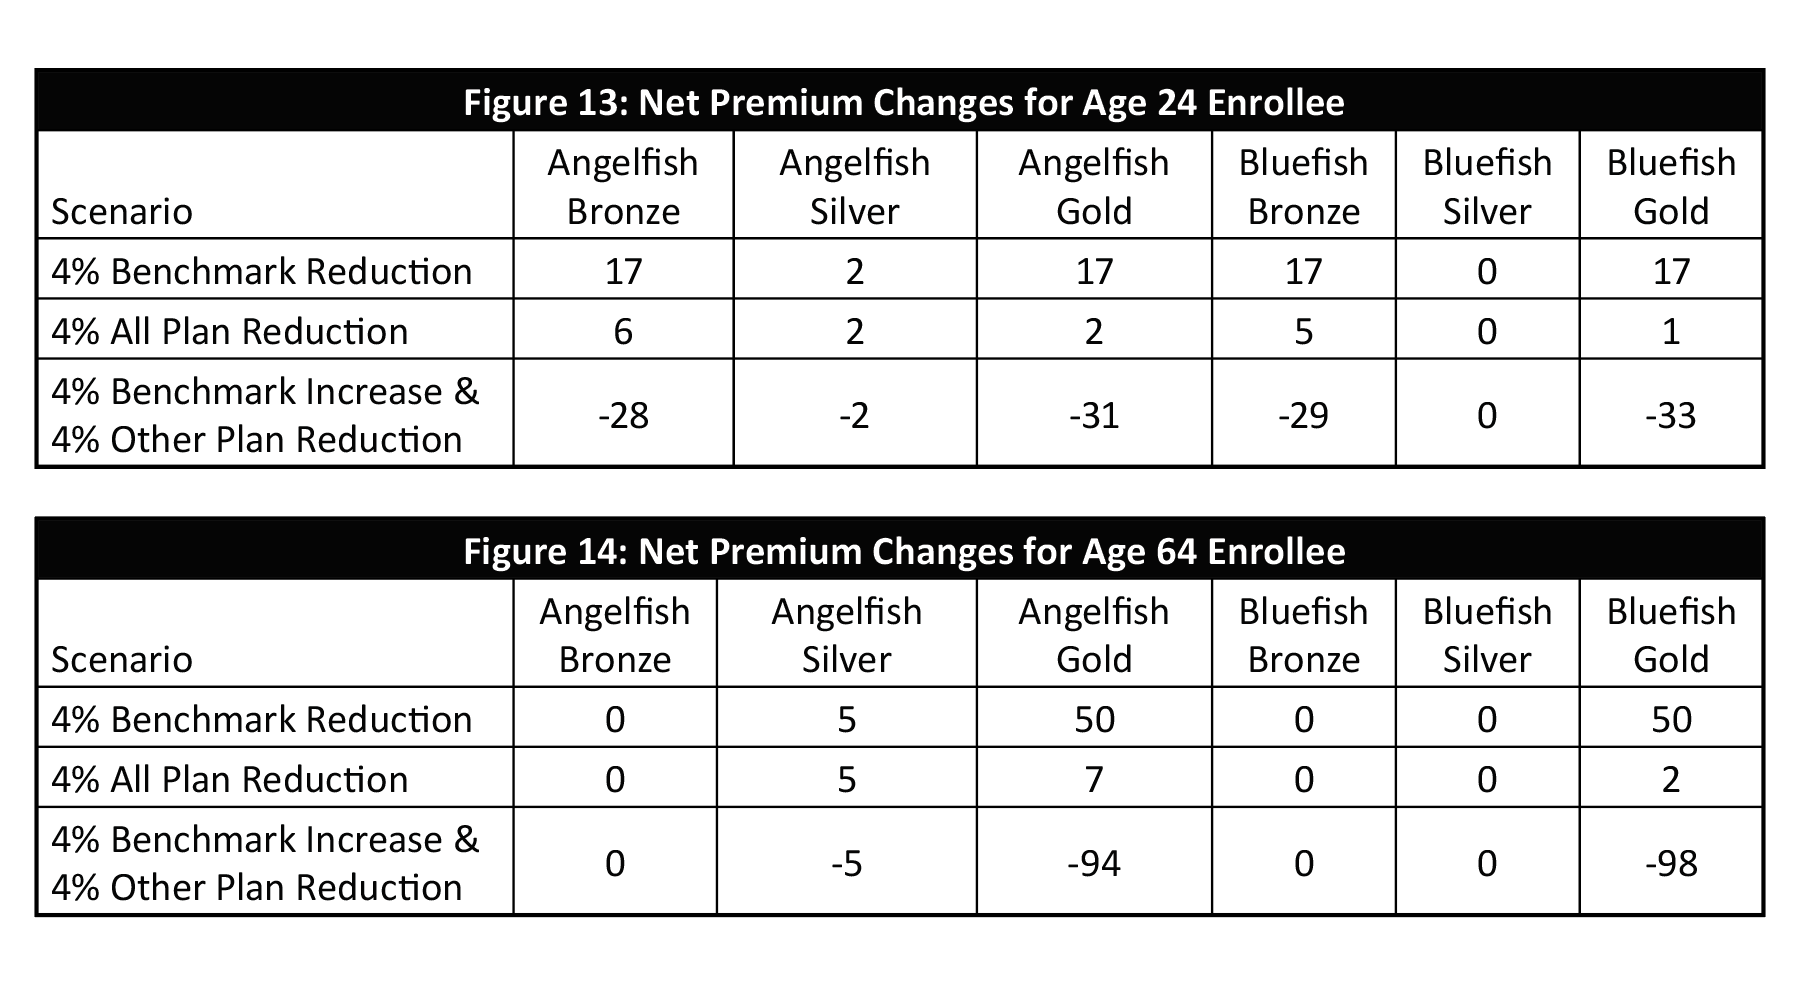
Figures 13 and 14 summarize the net premium changes for all scenarios. To reiterate the premium dynamics, the change in benchmark rates does not impact what consumers pay for a benchmark plan. It does determine premium subsidies, and consumers benefit when the benchmark plan is increased at a higher rate than other plans. As noted in Figure 14, when consumers are eligible for subsidy amounts that exceed bronze premiums, a further separation between silver plans and other plans adds more relative attractiveness to gold plans.
Savvy consumers want the benchmark plan to be relatively high and the plans they purchase to be relatively low. Of course, markets should not be artificially designed to exploit such a benefit, and consumers should not expect such favoritism. However, they should be assured that the premiums for all plans are designed in accordance with fair value and applicable ACA rules. In 2019, we concluded that “the overwhelming nationwide evidence is that Silver plans are inexplicably priced more aggressively than other levels, unnecessarily compressing federal subsidies and resulting in higher net premium costs for low-income individuals.” Many are subject to this compression due to Metalball games being played within ACA markets, which appears to be just as popular in 2020. It only adds insult to injury when reductions in benchmark rates provoke a ‘smile from a veil’ and are communicated to consumers as a cause for celebration.
The Real World Experience
“What if we reach up and touch the ground, To find we’re living life, upside down”
– Living Life Upside Down, by Truth
To some stakeholders, theoretical ACA mathematical dynamics on a spreadsheet may seem upside down, as if viewed through an actuarial lens. The real world impact is real; the mathematical illustrations are not abstract actuarial theories that don’t impact people’s lives. While generally celebrated, some commentators shined an appropriate light and fittingly expressed concern when benchmark premiums declined for the second year in a row. The concern was not only due to the premium decrease, but because the decrease was more than the plans people buy, directionally opposite of CBO market expectations. The unfortunate result is higher net premiums for low-income consumers and weakened markets.
On 10/23/19, I lamented “it’s clear consumers will pay more in 2020” and noted that the proportion of exchange enrollees with access to a plan with a premium less than $10 was down for the first time, from 39% to 31%. On 10/24/19, analytically minded brokers weighed in. Jenny Hogue observed the lionfish impact in Texas, “More options should help drive prices down. In theory. Doesn’t work in the marketplace. A new low-cost carrier drives the subsidy amounts down, which increases actual consumer costs.” Louise Norris concurred, “We’re seeing something similar in Colorado. More plans, and the biggest rate decreases in the country. But people with premium subsidies are receiving some unpleasant renewal notices.” On 10/26/19, ACA enrollment guru Charles Gaba wrote “The Storm is Coming: Prepare for REVERSE Silver Loading in 2020”.
A month later, a Health Affairs blog began “marketplace premiums will increase for significant segments of the currently enrolled population. This is because gross premiums are decreasing in the ACA marketplaces for the second year in a row”. Expectedly, lower 2020 enrollment was attributed to a non-financial rationale (e.g. the third year of a shorter open enrollment period) and the unfortunate financial dynamics were masked in most public commentary. While the mathematical subtleties are understood by those in the weeds, there is a tremendous failure to publicly communicate ACA results; we continue to report the same measures and falsely characterize their real impact; this diminishes our ability to understand problems and our desire to seek the right solutions.
Petitioning the Government
Despite what you may have read, outside of comments on proposed regulations, I had never called on the federal government to change its practices until last year. The impetus was the impact of 2019 premium rates being misinterpreted, and I hoped to avoid an encore in 2020. The portrayal of changing benchmark premium rates as consumer impact is troubling, and it is clearly the wrong measure. I asked the Centers for Medicare and Medicaid Services (CMS) to stop reporting this statistic and provide something more meaningful, a concept familiar to the agency. The lowest cost gold plan would be a better measure; even better would be the differential between this plan and the benchmark plan.
The benchmark plan is the worst measure. It is a fixed rail. It would be better to report nothing at all. The best measures vary by income level, and other factors (e.g. lionfish offering unattractive networks) are part of the equation. There is no perfect measure for consumer value, but the benchmark plan is definitionally the worst possible measure. It should be discussed in the context of federal budgets, not in the context of direct consumer impact. Consumers and all stakeholders should know the basic dynamics, “As benchmarks decline and gross premiums stay the same, consumers pay more. This results in a less attractive market and lower enrollment.” This is essentially what occurred in 2019 and 2020. We say see it again in 2021, although some states are taking direct action to speed market movement toward equilibrium.
As the regulatory authority for ACA premium rates, addressing Metalball challenges is a state issue. However, federal reporting influences what states and their local newspapers report. Federal reporting of benchmark premium reductions as a positive development is ultimately reported as positive news at the local level. ACA markets will improve as states and insurers adjust the underlying mechanics toward market equilibrium; facilitation and a better understanding of market improvements will occur through an institution of meaningful field measures, beginning at the federal level.
About the Author

Any views or opinions presented in this article are solely those of the author and do not necessarily represent those of the company. AHP accepts no liability for the content of this article, or for the consequences of any actions taken on the basis of the information provided unless that information is subsequently confirmed in writing.