Any views or opinions presented in this article are solely those of the author and do not necessarily represent those of the company. AHP accepts no liability for the content of this article, or for the consequences of any actions taken on the basis of the information provided unless that information is subsequently confirmed in writing.
Summary
One of the most underappreciated cornerstones of the Affordable Care Act (ACA) is that premium variation in the individual insurance market should reflect differences between plans, not differences between the people expected to enroll in each plan. This helps achieve the goal that “individual-market insurers … no longer compete based on their ability to avoid risk, but rather on their ability to deliver high-quality care at an affordable price.”[1]
That same cornerstone also prevents premiums from rising for plans that attract people with preexisting conditions. This preserves “modified community rating,” where premiums vary with expected risk only for age (within a 3-to-1 maximum permitted ratio), geography, and (in many states) tobacco use. Accordingly, ACA regulations provide that, after an insurer determines the average cost of covered benefits for all of its individual market enrollees, premium variation between the insurer’s plans is limited to specific “actuarially justified” factors, such as “actuarial value and cost-sharing.”[2] If otherwise identical plans vary only in the percentage of covered claims that they pay, the plan that pays the smaller percentage should charge lower premiums.
Actuaries report widespread departures from this basic principle.[3] Especially after former President Donald Trump ended federal payments for cost-sharing reductions (CSRs) legally required for silver-tier exchange enrollees with incomes at or below 250% of the federal poverty level (FPL), metal-level premiums have diverged from coverage generosity in most states’ exchanges.
In this report, we go beyond anecdotes and analyze 2020 data from 46 states’ health insurance exchanges.
We find that, in most states, variation in metal-level premiums does not correspond to differences in coverage generosity. For example, in the state with the median level of correspondence between premiums and coverage generosity:
- Silver premiums cover 10% more paid claims, for a standard population, than gold premiums, but silver premiums are 9% lower than gold.
- Silver premiums cover 58% more claims, for a standard population, than bronze premiums, but silver premiums are only 34% higher than bronze.
Put simply, premiums for silver plans are too low in most states, and premiums for bronze and gold plans are generally too high.
We find that this misalignment is consequential. If 2020 premiums matched coverage generosity as required by the ACA’s pricing rules, individual market coverage would have been substantially more affordable for the vast majority of affected consumers:
- Nearly all exchange consumers (97%) would have spent less. Only 3% of consumers would have seen their costs rise.
- Exchange consumers as a whole would have netted $5.9 billion in savings during 2020.
- People earning between two and four times FPL would have gained the most under properly aligned premiums. They would have saved $938 a year on average.
- Among uninsured adults eligible for advance premium tax credits (APTCs), the proportion with access to plans costing no more than their credits would have risen from 30% to 51%. If many enrolled who gained access to essentially free insurance, fewer people would have lacked coverage, individual market risk pools would have been healthier, and premiums would have fallen for those who buy insurance without APTCs.
The key cause of current metal-level misalignment is that insurers maximize both overall market share and enrollment of especially profitable consumers by aggressively underpricing silver-tier coverage and making up the difference by raising premiums at other metal levels. Low-income silver-tier consumers are the largest group of individual market customers, and they are extremely price-sensitive. The lowest-cost silver plan is thus likely to garner large membership.
Moreover, silver-tier enrollees are especially profitable because federal risk adjustment formulas overcompensate plans for silver members. These formulas retain key elements that were originally based on claims incurred by people enrolled in generous large-group plans. In reality, silver-tier enrollees in CSR plans under the ACA have low incomes and tend to use fewer services on average than beneficiaries of generous job-based plans.
To fix metal-level misalignment and substantially lower consumer costs, state regulators should require insurers, across the ACA-conforming individual market, to follow the ACA’s pricing guidelines. At the same time, federal regulators should update risk adjustment to match the actual characteristics of people enrolled in silver-tier exchange plans, thereby reducing insurers’ financial incentives to skirt the letter of the law. Such steps would go a long way toward addressing what is often identified as the most fundamental problem facing the individual market: the unaffordability of coverage and care.[4]
Background
History and algebra help explain the current divergence between metal-level premiums and coverage generosity. When exchanges began, silver premiums financed only baseline silver coverage with 70% actuarial value (AV) because separate federal payments covered CSR costs. Starting in 2018, the first year after federal CSR payments ended, most state regulators required or allowed insurers to cover CSR costs through silver exchange premiums. This followed the actuarial principle that “insurance premiums [must] accurately reflect the coverage that they insure.”[5] By increasing silver premiums, such “CSR loading” or “silver loading” increased APTCs, which are calculated based on the “benchmark” premium charged by the second-cheapest silver plan.
Silver exchange premiums now finance paid claims for enrollees at multiple AV levels. Nationally, more than 70% of silver exchange members are in 87% or 94% AV plans,[6] suggesting that overall coverage generosity is greater in silver plans than in 80% AV gold plans.
But by how much? And how does that compare to premium differences between these metal tiers?
Quantifying coverage generosity involves both the percentage of covered claims a plan pays and the increased utilization that results from lower cost sharing. To estimate such induced demand, the ACA forbids taking into account the characteristics of each plan’s expected enrollees. Instead, utilization must be projected for a standard population that has the “average demographics of the single risk pool” made up of all the carrier’s individual market members.[7] The U.S. Department of Health and Human Services’ Center for Consumer Information and Insurance Oversight (CCIIO) developed one such estimate of the relationship between AV and utilization in a representative population.[8] Applying that estimate to the national distribution of silver exchange members among CSR-variant plans[9] yields the conclusion that overall coverage generosity in silver is 60% higher than in bronze and 12% higher than in gold.[10] By contrast, national average lowest-cost silver premiums are just 6% (rather than 60%) above lowest-cost bronze premiums and 12% below (rather than 12% above) lowest-cost gold premiums.[11]
In this report, we go beyond these national numbers to examine state-specific data. We find widespread misalignment between premiums and coverage generosity, which substantially raises costs for consumers — especially for consumers with incomes above 200% of FPL. Our analysis was based on APTC levels in 2020 and so does not incorporate the effects of the American Rescue Plan, recently signed into law.
Study Data and Methods
Data sources
For the income and age of exchange enrollees by state and metal level, we use CCIIO’s 2020 Marketplace Open Enrollment Public Use Files.[12] For the characteristics of uninsured adults, we analyze American Community Survey data for 2018, accessed via IPUMS USA, University of Minnesota, www.ipums.org.[13] For 2020 bronze-, silver-, and gold-tier lowest-cost premiums and for benchmark premiums, we use the Kaiser Family Foundation’s state averages for 40-year-old nonsmokers. We exclude (1) Idaho and Nevada because of incomplete federal enrollment data and (2) the District of Columbia, Minnesota, and New York because their exchanges do not include people with incomes below 200% of FPL, who qualify for the most significant CSRs.[14]
Measures
We develop state measures in three categories. First, we estimate “premium misalignment,” which we define as the difference between the ratio of average metal-level premiums and the ratio of average metal- level coverage generosity. We quantify the latter based on paid claims that would result from utilization by a standard population.[15] Second, we calculate “realigned premiums” in each state that would fit each metal level’s relative coverage generosity while generating the same total premium revenue for the current distribution of exchange membership.[16] Third, we assess the impact of such realigned premiums on consumers by examining three factors:
- Changes to “net premiums” — that is, the premiums consumers pay. For APTC beneficiaries, net premiums equal the difference between gross premiums and APTCs.
- Changes to average out-of-pocket costs for consumers moving from silver coverage with 70% or 73% AV to gold coverage with 80% AV.
- Changes to the number of uninsured adults with access to “zero-net-premium” bronze plans — that is, plans with premiums that do not exceed APTCs.
Analysis
In each state, we quantify coverage generosity for silver plans, based on members’ distribution by FPL (hence CSR eligibility) and CCIIO’s above-noted estimated relationship between AV and utilization.
These factors let us calculate average paid claims for each state’s silver exchange enrollees, assuming a standard population, compared with members in bronze and gold exchange plans, assumed to have 60% and 80% AV, respectively.
We calculate realigned, lowest-cost premiums that meet two criteria: (1) The ratio between bronze, silver, and gold premiums is the same as the ratio of coverage generosity between metal tiers, and (2) the same total premium revenue for these three metal levels results from current and from realigned premiums. Premiums as a whole are thus unchanged, but their distribution among metal levels reflects relative differences in coverage generosity. We determine realigned benchmark premiums by applying the current percentage difference between lowest-cost and second-lowest-cost silver premiums shown in Kaiser Family Foundation averages.
With both actual and realigned premiums, we calculate net premiums for 40-year-old nonsmokers, assuming enrollment at current metal tiers except when switching from silver to gold would lower consumers’ overall costs, including average out-of-pocket costs.[17] We adjust cost estimates based on the average age of enrollees in each metal tier and state, modifying the federal age rating curve in states with less than the federally permitted 3-to-1 maximum ratio.[18]
We then determine, for adults at each age from 19 through 64, whether zero-net-premium bronze plans are available, with current and realigned premiums, within income bands that do not exceed 50 percentage points of FPL. The lowest income band begins at 139% of FPL in states that expanded Medicaid by January 2020 and 100% of FPL elsewhere. We exclude a fixed percentage of noncitizens from estimated APTC eligibility based on past results using imputations developed by the Urban Institute, the Pew Research Center, the U.S. Department of Homeland Security, and the Center for Migration Studies.[19] We do not estimate access to unaccepted job-based coverage offers that would preclude APTC eligibility. We analyze the cost
to uninsured adults of single-adult bronze coverage, assuming APTCs for one-person households at each age and the top of each income band. We do not estimate access to zero-net-premium plans in Massachusetts and Vermont because these states limit age rating, which greatly affects access to zero-net-premium coverage.
Limitations and scope
This analysis is approximate. We rely on state averages rather than county-specific data, and we make many simplifying assumptions, starting with our assumption that bronze and gold plans hit their AV targets of 60% and 80%, without de minimus variation allowed by the ACA.[20] We do not analyze either platinum or catastrophic coverage, because of limited data availability and these plans’ limited membership in most states. Given these limitations, our results are not precise predictions. Rather, they indicate the likely direction and approximate magnitude of consumer cost effects that could result from realigning metal-level premiums to fit coverage generosity. Future work will undertake more granular analysis.
Results
Current Premium Misalignment
Exhibit 1 shows each state’s relationship between coverage generosity and average premiums. The analysis shows how premiums depart from what one would expect if carriers followed the ACA and varied premiums to reflect paid claims estimated based on a standard population. Using that criterion, 41 out of 46 states have silver premiums more than 10% too low relative to either bronze or gold, including 35 where misalignment exceeds 10% relative to both. Only one state has silver premiums that exceed expected levels by more than 10%. In the state with median levels of misalignment, silver premiums are 15% too low, relative to bronze, and 18% too low, relative to gold.
Impact of Realigned Premiums
Premiums. If metal-tier premiums were realigned to fit coverage generosity, bronze and gold premiums would fall, and silver premiums would rise in 39 out of 46 states (Exhibit 2).[21] In the median state, bronze and gold premiums would drop by 9% and 11%, respectively. Median silver premiums would rise 7%, increasing APTC values.
People currently in exchange plans. Both overall and with most specific populations, premium realignment would help many more than it would harm, and average savings would far exceed average cost increases.
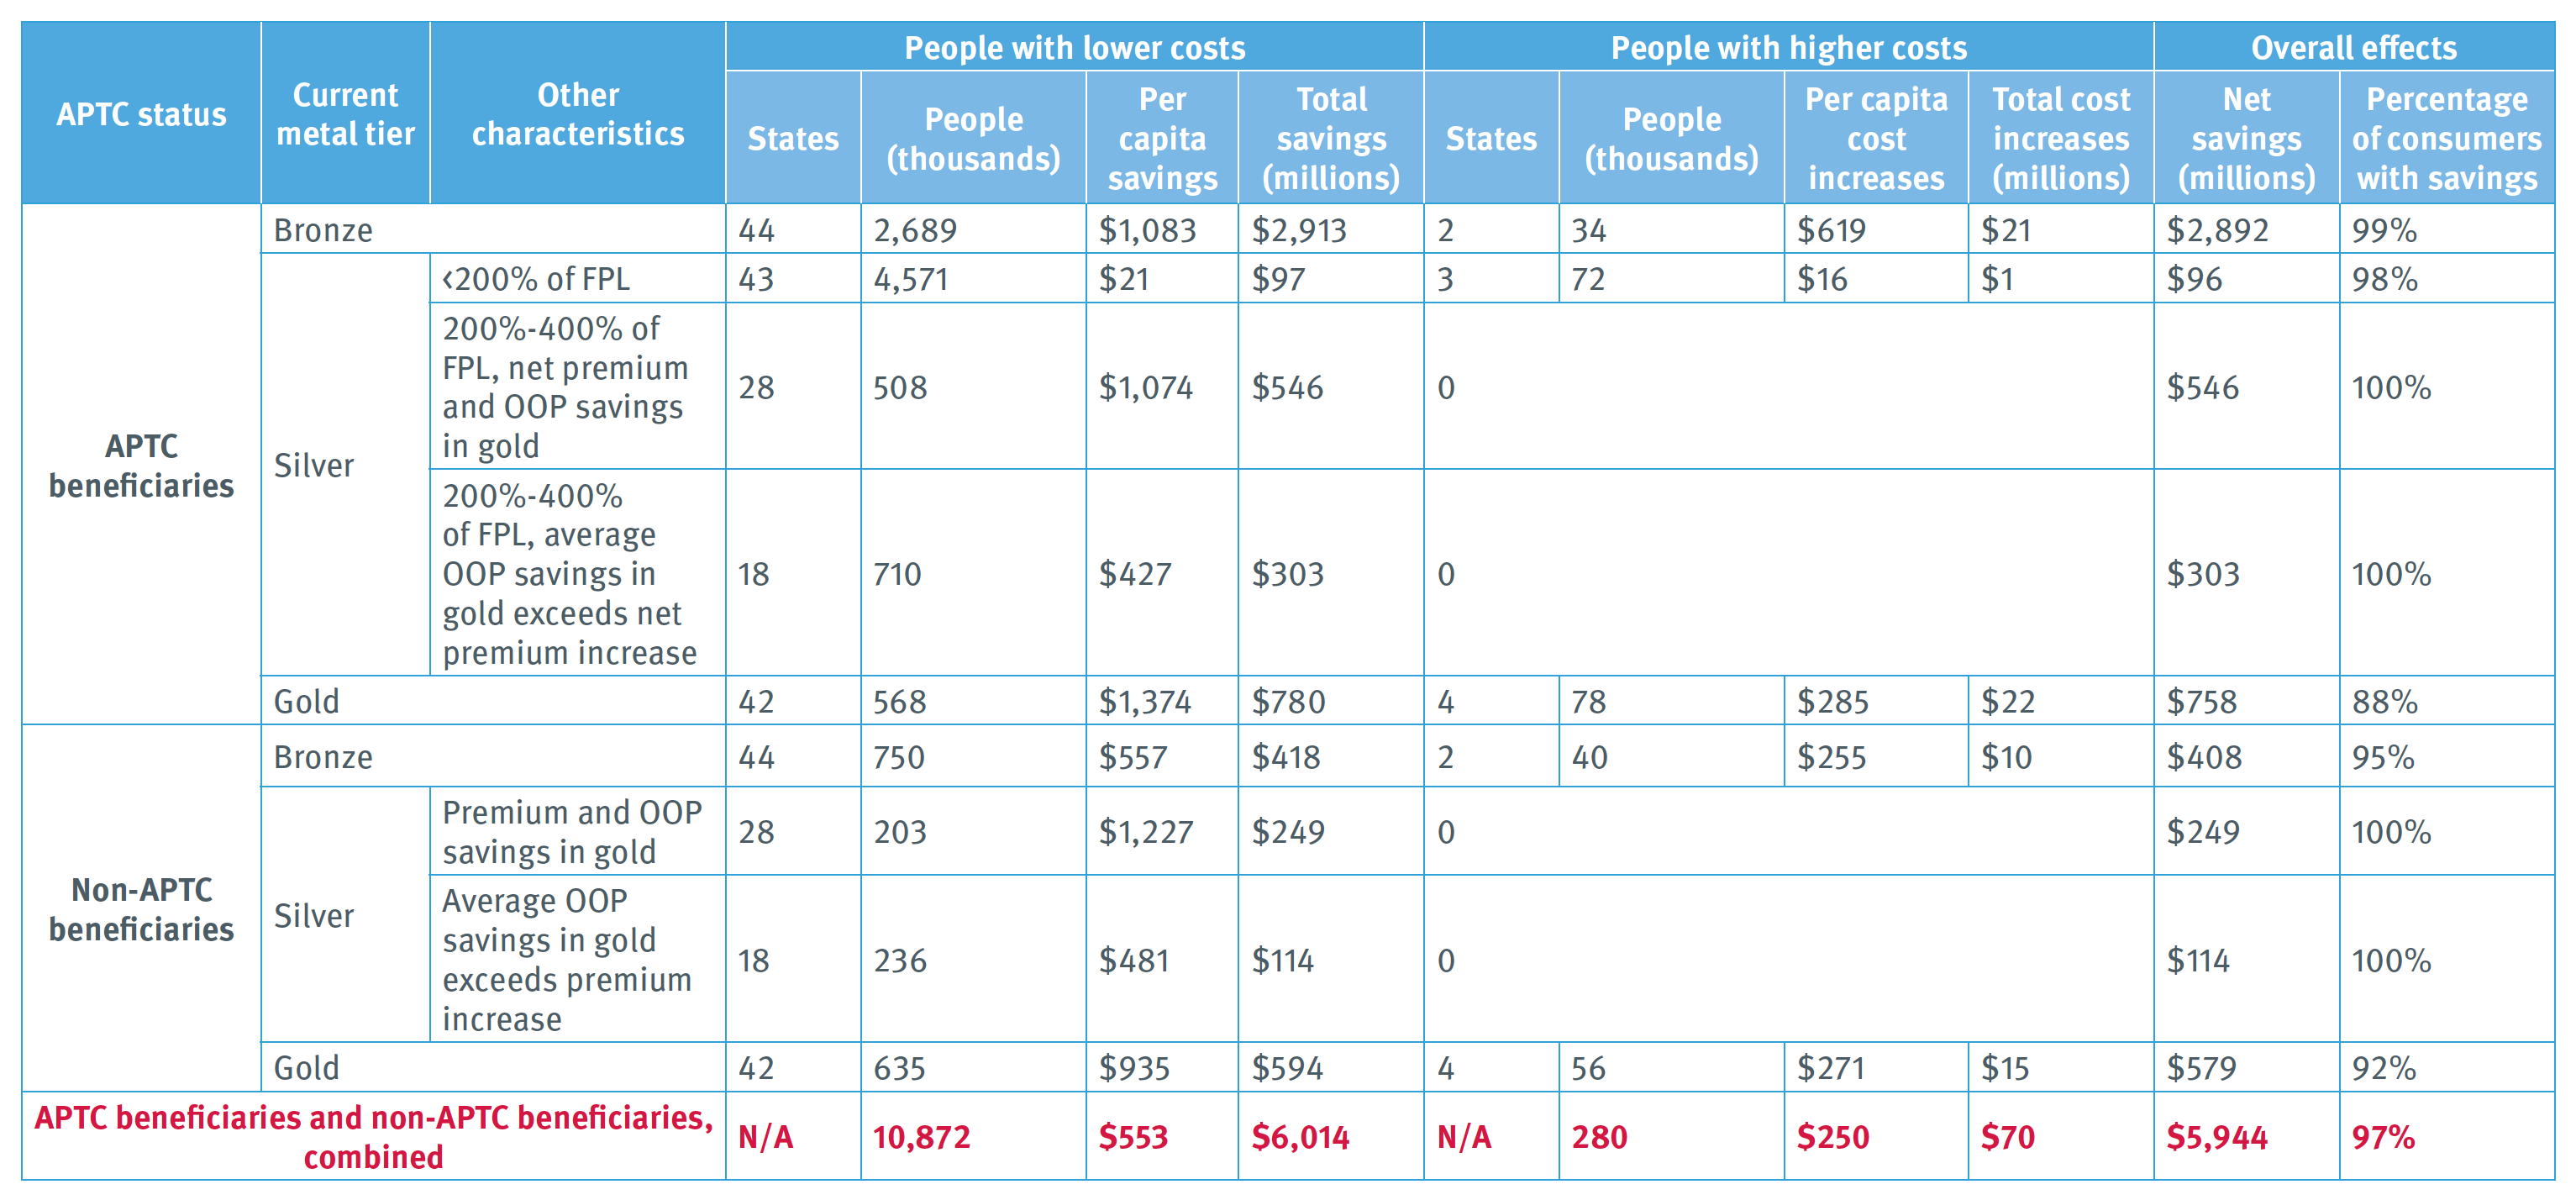
Overall effects. An estimated 97% of people covered through exchanges would experience savings (Exhibit 3). Costs would fall for 10.9 million consumers. Their annual savings would average $553, totaling $6.0 billion. Costs would rise for fewer than 300,000 consumers, with increases averaging $250 a year and totaling $70 million. Net savings for consumers would thus total $5.9 billion.
Specific populations. In this section, we organize our discussion based on complexity. The simplest situation involves consumers who buy bronze and gold plans without APTCs:
- In 44 states where bronze premiums would fall, 750,000 bronze non-APTC enrollees would save an average of $557 a year, totaling $418 million. In two states where bronze premiums rise, 40,000 people who buy bronze coverage without APTCs would pay $255 more on average, totaling $10 million.
- In 42 states where gold premiums would fall, 635,000 people buying gold plans would save an average of $935 a year, totaling $594 million. In four states where gold premiums would rise, 56,000 people would pay more, with increases averaging $271 a year and totaling $15 million.
The second-simplest situation involves APTC beneficiaries buying bronze or gold plans. Their net premiums equal income-based payments required to purchase benchmark coverage plus or minus the difference between premiums for the benchmark plan and the beneficiary’s chosen plan. In states where realignment of metal premiums increases silver (hence benchmark) premiums while lowering gold and bronze premiums, consumers benefit from both increased APTCs and reduced bronze and gold premiums.
Accordingly:
- In 44 states, 2.7 million people who use ATPCs to buy bronze plans would save an average of $1,083 in annual net premiums, totaling $2.9 billion. In two states, 34,000 APTC beneficiaries would pay an average of $619 more for bronze, totaling $21 million.
- In 42 states, 568,000 APTC beneficiaries would pay $1,374 less for gold plans on average, saving a total of $780 million. In four states, 78,000 APTC gold beneficiaries would see average costs rise by $285, totaling $22 million.
The most complex situation involves enrollees in silver plans. Most would save, but the path to savings varies:
- APTC beneficiaries with incomes below 200% of FPL could save a small amount on net premiums charged for the lowest-cost silver plan if realignment increases the difference between lowest-cost and benchmark premiums.
Accordingly, in 43 states, 4.6 million such beneficiaries could save an average of $21 a year, totaling $97 million. In two states, 72,000 people would see net premiums rise by an average of $16 a year, totaling $1 million.
- For APTC silver enrollees with incomes between 200% and 400% of FPL, outcomes differ by state:
-
- In 28 states, 508,000 APTC beneficiaries could lower net premiums by moving to gold plans. They would save an average of $1,074 on net premiums and out-of-pocket costs combined, for a total of $546 million.
-
- In 18 states, 710,000 people would pay more in net premiums for realigned gold coverage than they now pay for lowest-cost silver plans. However, their average savings in out-of- pocket costs would exceed increased premium payments. Net individual savings would average $427 a year, totaling $303 million for all affected members. (Some in this group may end up with increased rather than reduced costs, if they either incur health care costs significantly below average or remain in silver plans even though a gold plan represents a better option under realignment.)
- For silver enrollees without APTCs (those above 400% of FPL), outcomes similarly vary:
-
- In 28 states, 203,000 people would save on premiums by moving from silver to realigned gold coverage. On average, they would spend $1,227 less on premiums and out-of-pocket cost sharing combined, for a total savings of $249 million.
-
- In 18 states, 236,000 people would pay higher premiums for realigned gold than for current silver, but their average out-of-pocket savings would exceed premium increases. Net annual savings would average $481 per person, totaling $114 million. (The same parenthetical caution we raise above regarding silver enrollees between 200% and 400% of FPL applies to this group as well. Some would see their net costs rise, either because they use few services or because they fail to change from their former silver plan to a new gold-level option that saves them money.)
Aggregating effects by income band, ATPC beneficiaries with incomes between 200% and 400% of FPL would experience the greatest gains, saving $938 per person, on average. (Exhibit 4). They are roughly a third of exchange members (32%), but realize slightly more than half of realignment’s total gains (56%). Consumers ineligible for APTCs would save $702, on average. APTC beneficiaries earning below 200% of FPL would experience the smallest average net savings: $222 a year.
Uninsured adults with access to zero-net-premium coverage. In most states, realignment would simultaneously (1) increase APTC amounts by raising silver premiums and (2) lower bronze premiums. Many more uninsured adults would thus gain access to bronze plans with premiums that do not exceed their APTCs. The number of such adults in the states we analyze would rise from 3.0 million — 30% of uninsured adults who potentially qualify for APTCs, based on income and immigration or citizenship status — to 5.1 million, or 51% of all such uninsured adults (Exhibit 5).
Discussion
This assessment, based on state data, suggests that metal-level premium misalignment is widespread and imposes significant costs on consumers. Aligning premiums with coverage generosity could help address the serious affordability challenges that many consumers now face in the individual market. Those challenges are the most frequently cited reason uninsured adults give for continuing to lack coverage.[22] In 42 out of 46 states, more than 75% of exchange beneficiaries would realize savings with premium realignment, and in all but one state, total savings would exceed total cost increases (Exhibit 6).
To analyze misalignment’s causes and remedies, we focus the following discussion on two topics: state insurance regulation and federal risk adjustment.
State Insurance Regulation
Insurers’ incentives. Some insurers have incentives to aggressively underprice silver plans, which low-income consumers must select to obtain high-AV coverage. Comprising the bulk of silver exchange enrollees, consumers with incomes below 200% of FPL typically make enrollment decisions based on small premium differences.[23] Whichever insurer wins the “pole position” by offering the lowest-cost silver plan is thus likely to garner considerable market share.
Regulators’ limited scrutiny of aggressively underpriced silver premiums. It is understandable why the underpricing of silver exchange plans has received little attention from regulators traditionally focused on guarding against excessive premiums. With every other form of insurance, lowering premiums saves consumers money, triggering less need for regulatory scrutiny. Only silver exchange premiums have the unexpected and counterintuitive feature that costs for many consumers rise when premiums fall, since only silver exchange premiums determine the amount of financial assistance consumers throughout the affected geographic area receive under the federal tax code.
Moreover, the individual insurance market experienced significant instability several years ago. Some carriers left. Many regulators understandably prioritized retaining and recruiting insurers. Despite greater stability and profitability in today’s markets, some regulators may still shy away from measures they fear could potentially discourage insurer participation.
Finally, media accounts and government reporting often mischaracterize silver exchange premiums as the key measure of affordability. A regulator who holds insurers accountable for following the ACA’s pricing rules risks public criticism for silver premium increases, even if those steps substantially lower consumers’ overall health care costs.
Correcting misalignment. State insurance regulators can address metal-level premium misalignment by incorporating three principles into rate review and their instructions to pricing actuaries. The first involves “induced demand,” increased utilization that results from lower cost sharing. Some insurers assume greater induced demand in gold plans than in silver, even though overall cost sharing is lower in silver plans than gold. The ACA’s anti-discrimination rules forbid precisely this kind of price setting, which effectively bases premiums on the risk profile of members expected to enroll in a particular plan rather than the generosity of coverage. Federal guidelines specify that any “utilization difference” between plans “may reflect the impact higher cost-sharing has on utilization but cannot reflect differences due to health status” (emphasis added).[24] Insurance regulators can address this problem by requiring insurers to make induced-demand assumptions that project higher utilization when plans have lower overall cost sharing.
Second, regulators can reject efforts to vary metal-level premiums based on past utilization in each metal tier. To justify higher premiums in gold than silver, actuaries sometimes characterize proposed premiums as filling the gap between paid claims and risk transfer payments.[25] This bases premiums on plan-specific claims experience rather than the insurer’s total risk pool. The ACA prohibits such risk rating because it undermines market efficiency and potentially raises premiums for plans that attract people with preexisting conditions, as explained earlier.
Third, regulators can instruct insurers to use common assumptions about the distribution of silver members among AV variants. Ideally, carriers should be instructed to assume that all silver members receive high-AV coverage. That resembles current market conditions in most states. It also reflects rational consumer behavior. Rational purchasers would not pay premiums based on AV above 70% for a plan that provides them with only 70% AV coverage. This is especially true in states where some silver plans are sold only off-exchange, neither providing CSRs nor raising premiums to cover CSR costs.
Assuming rational consumer behavior stabilizes markets. If silver exchange premiums reflect the assumption that most silver enrollees receive high-AV coverage, silver prices will exceed gold. Fewer consumers ineligible for high-AV plans will choose silver exchange plans since they can buy more comprehensive gold coverage at a lower cost. Precisely such patterns have emerged in the relatively few states with silver prices consistently higher than gold.[26] Assumed consumer behavior and the resulting actual consumer behavior will thus be consistent, mutually reinforcing, and stable.
By contrast, insurers in competitive markets now face an inherently unstable pricing paradox. An insurer that assumes significant enrollment in high-AV silver must increase silver premiums, which inhibits enrollment by the low-income people who qualify for high-AV coverage. An insurer that instead assumes limited high- AV enrollment will lower its silver premiums, increasing high-AV enrollment. In other words, assuming significant enrollment into high-AV plans reduces such enrollment, and assuming limited enrollment increases it. Regulators can remedy this inherently unstable dynamic by directing insurers to use consistent, marketwide enrollment assumptions that both assume and encourage rational consumer behavior.
Without focused regulatory enforcement that incorporates these three principles, insurers that break the ACA’s pricing rules can profit by amassing market share, while law-abiding insurers lose enrollment and may become less profitable. If instead a regulator requires all of a state’s insurers to follow common guidelines, the industry can benefit, along with consumers. More affordable coverage means more customers. Moreover, increased enrollment in gold promotes retention since consumers are likely to see lower-deductible plans as offering greater value.
Risk Adjustment
Federal risk adjustment does not take into account low-income consumers’ concentrated enrollment in silver plans. That gap may contribute to misalignment of metal-level premiums.
People who earn less use fewer services, all else being equal.[27] Low-income consumers are particularly likely to enroll in silver exchange plans as their only affordable source of high-AV coverage. Nevertheless, neither risk adjustment nor ACA-permitted premium variation addresses the foreseeable impact of income in reducing utilization of high-AV silver coverage.
CCIIO’s original risk adjustment model primarily reflected claims data from large-group plans. This implicitly assumed that consumers respond to low cost sharing by increasing utilization in similar ways, whether they are low-income people in high-AV silver exchange plans or relatively affluent corporate employees with generous group plans.
When the ACA’s full coverage provisions became effective in 2014, a separate federal payment stream covered silver-level claims attributable to AV above 70%. Those costs therefore were excluded from risk adjustment, which seeks to fill the gap between premiums allowed by ACA rules and expected paid claims covered by those premiums. However, risk adjustment compensated for induced utilization affecting the baseline 70% silver AV, assuming such baseline coverage would pay 12% more claims for consumers in 87% or 94% AV plans.[28] Under today’s very different conditions, it seems unlikely that this vestigial “induced utilization factor” fits utilization trends for the distinctively low-income population enrolled in high-AV silver.
ACA risk adjustment is generally cost-neutral within each state.[29] As a result, if silver plans are overcompensated because risk adjustment ignores income’s impact on utilization, bronze and gold plans are underpaid by corresponding amounts. That combination increases profitability of silver enrollees and cuts profitably of members at other metal tiers. Rather than make money by offering better products at lower prices, insurers have incentives to compete by securing profitable membership, manipulating premiums to encourage silver enrollment.
In competitive markets, insurers face pressure to base premiums on claims costs for actual members plus or minus risk adjustment. If risk adjustment overpays silver and overcharges other plans, these competitive pressures would encourage offsetting premium decreases in silver and increases at other metal levels.
CCIIO has made important changes to its original risk adjustment model. For example, the agency now uses data from individual and small-group markets under the ACA to calculate risk adjustment factors for each metal level. CCIIO should build on that approach by calculating a specific set of risk adjustment factors that fit paid claims for enrollees in 87% and 94% AV individual market plans. Such enrollees far outnumber people in platinum, gold, and catastrophic plans, each of which already has separately calculated risk adjustment factors. Risk adjustment based on the actual utilization patterns of high-AV silver members would almost certainly fit current conditions more closely than an induced utilization factor leftover from a very different past.
Conclusion
To promote high-functioning insurance markets and limit discrimination against people with conditions that foreseeably result in high health care costs, the ACA forbids plan premiums from rising or falling based on insurers’ expectations about the characteristics of each plan’s enrollees. Instead, premium variation between plans is supposed to match the underlying generosity of coverage. In most states, insurers are departing from this principle by underpricing exchange plans at silver levels and overpricing plans in bronze and gold. This has substantially raised consumer costs in the individual market, especially for APTC beneficiaries with incomes above 200% of FPL. Both state and national regulators should take immediate action to fix this significant affordability problem.
Exhibit 1. Misalignment between Exchange Plan Premiums and Coverage Generosity, by State and Metal Tier: 2020

Sources: Analysis of data from the Center for Consumer Information and Insurance Oversight, 2020, and the Kaiser Family Foundation, 2020.
Notes: Premium misalignment is a measure of how the ratio of premiums charged for plans of different metal-tier levels diverges from the ratio of coverage generosity of those same levels, defined in terms of paid claims estimated based on a standard population. For example, in Alabama, silver premiums are 17% lower, relative to bronze premiums, than what one would expect based on paid-claims at these two metal tiers, estimated based on a standard population.
Exhibit 2. How Realignment Would Change Exchange Plan Premiums, by State and Metal Tier: 2020
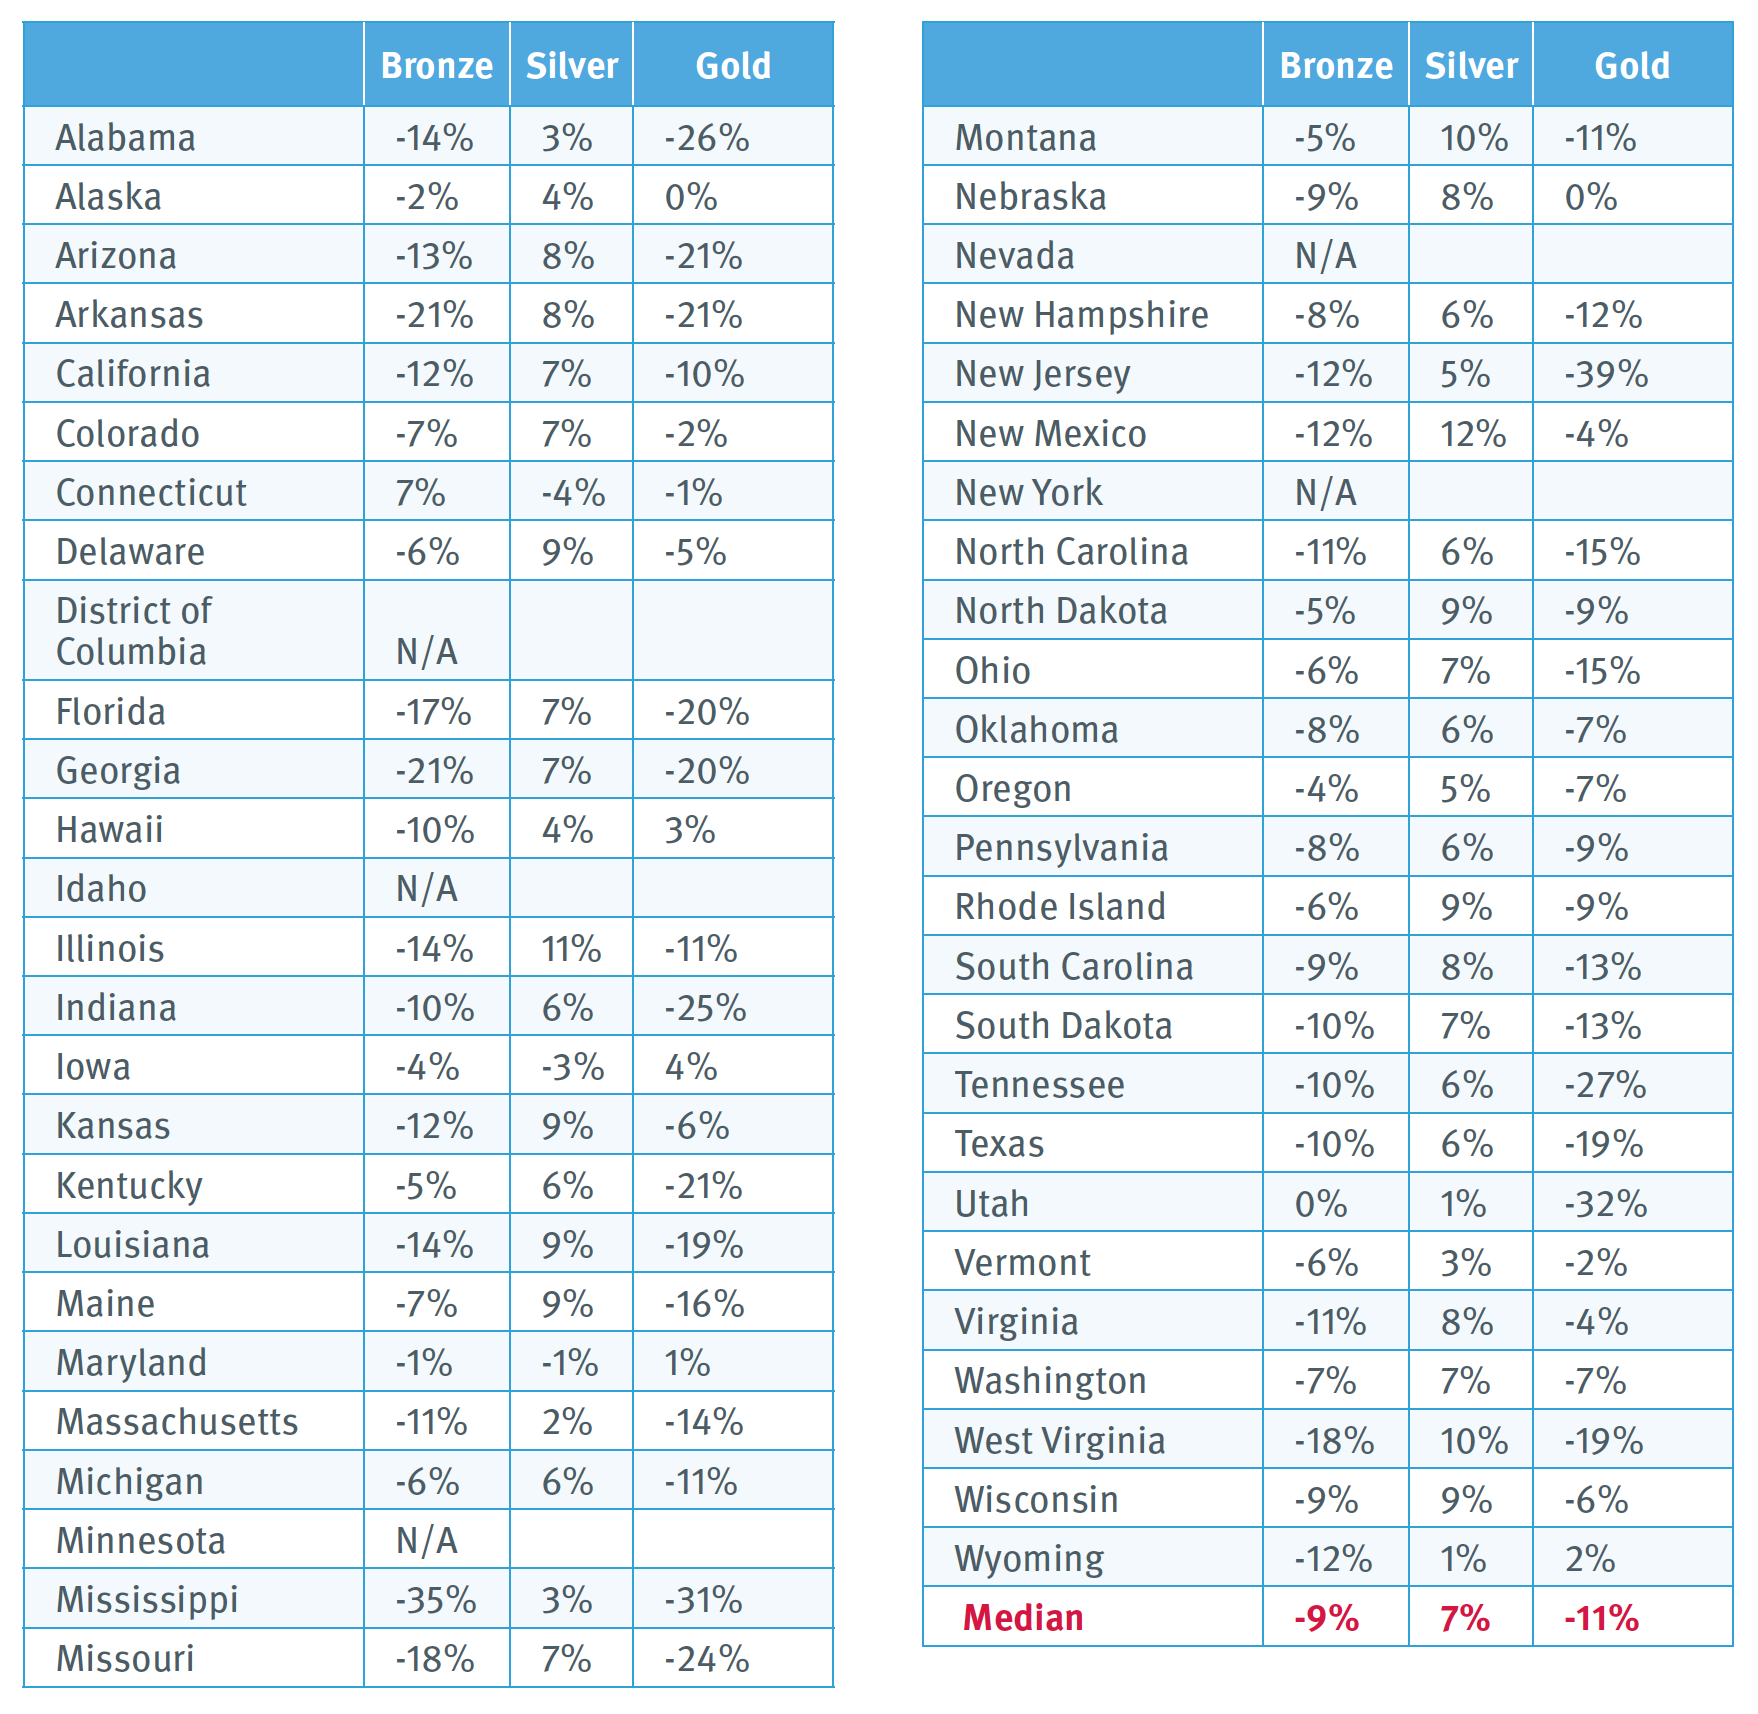
Sources: Analysis of data from the Center for Consumer Information and Insurance Oversight, 2020, and the Kaiser Family Foundation, 2020.
Notes: This exhibit shows how lowest-cost premiums at each metal tier (and second-lowest-cost silver premiums) would change if metal-tier premiums were realigned based on coverage generosity, defined in terms of paid claims estimated for a standard population.
Exhibit 3: Impact of Realigned Premiums on Consumers Currently Enrolled in Exchange Plans: 2020
Sources: Analysis of data from the Center for Consumer Information and Insurance Oversight, 2020, and the Kaiser Family Foundation, 2020.
Notes: This exhibit shows the estimated impact on consumers in 46 states if metal-tier premiums were realigned to fit differences in coverage generosity, defined in terms of paid claims estimated for a standard population. APTC = advance premium tax credit. FPL = federal poverty level. OOP = out-of-pocket costs. Silver PTC beneficiaries above 200% of FPL and silver non-PTC beneficiaries are assumed to move to gold. Both for these PTC beneficiaries and non-PTC beneficiaries, the table divides them between the 28 states where people transitioning from silver to gold save both on premiums and OOP costs; and 8 states where people transitioning from silver to gold spend more on premiums in gold but whose average OOP savings exceed their increased premiums in gold.
Exhibit 4: Distribution of Exchange Enrollment and Savings from Premium Realignment by Income and Advance Premium Tax Credit Status: 2020
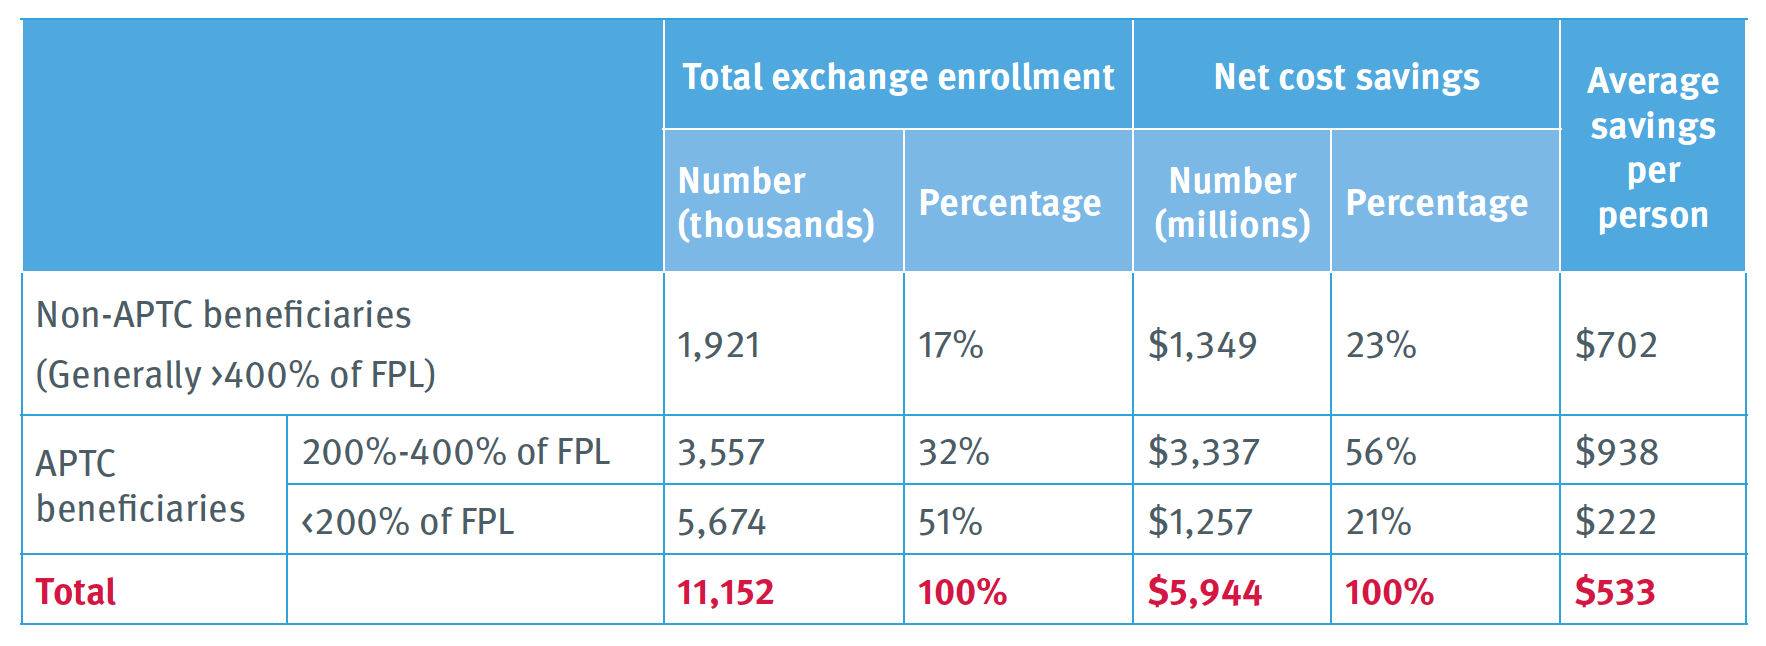
Sources: Analysis of data from the Center for Consumer Information and Insurance Oversight, 2020, and the Kaiser Family Foundation, 2020.
Notes: APTC = advance premium tax credit. FPL = federal poverty level. Estimates include consumers in 46 states. Totals may not sum because of rounding.
Exhibit 5: Uninsured Adults Potentially Eligible for Advance Premium Tax Credits Who Have Access to Zero-Net-Premium Plans: Current vs. Realigned Premiums (2020)

Sources: Analysis of data from the Center for Consumer Information and Insurance Oversight, 2020; the Kaiser Family Foundation, 2020; and the American Community Survey, 2018, IPUMS USA, University of Minnesota, www.ipums.org.
Notes: This exhibit shows the estimated impact on consumers if metal-tier premiums were realigned based on coverage generosity, defined as paid claims estimated for a standard population. Totals do not include the District of Columbia, Idaho, Massachusetts, Minnesota, Nevada, New York, or Vermont, due to gaps in CCIIO enrollment data, exchanges’ exclusion of consumers below 200% of the federal poverty level, or state limits on age rating. Potentially eligible uninsured adults are age 19-64 who meet requirements for advance premium tax credits that involve income and citizenship or immigration status. Someone is offered “zero-net-premium” coverage if the lowest-cost bronze plan’s premium does not exceed the individual’s premium tax credit. Displayed percentages do not match numerical totals because of rounding.
Exhibit 6. Overall Impact of Premium Realignment, by State: 2020
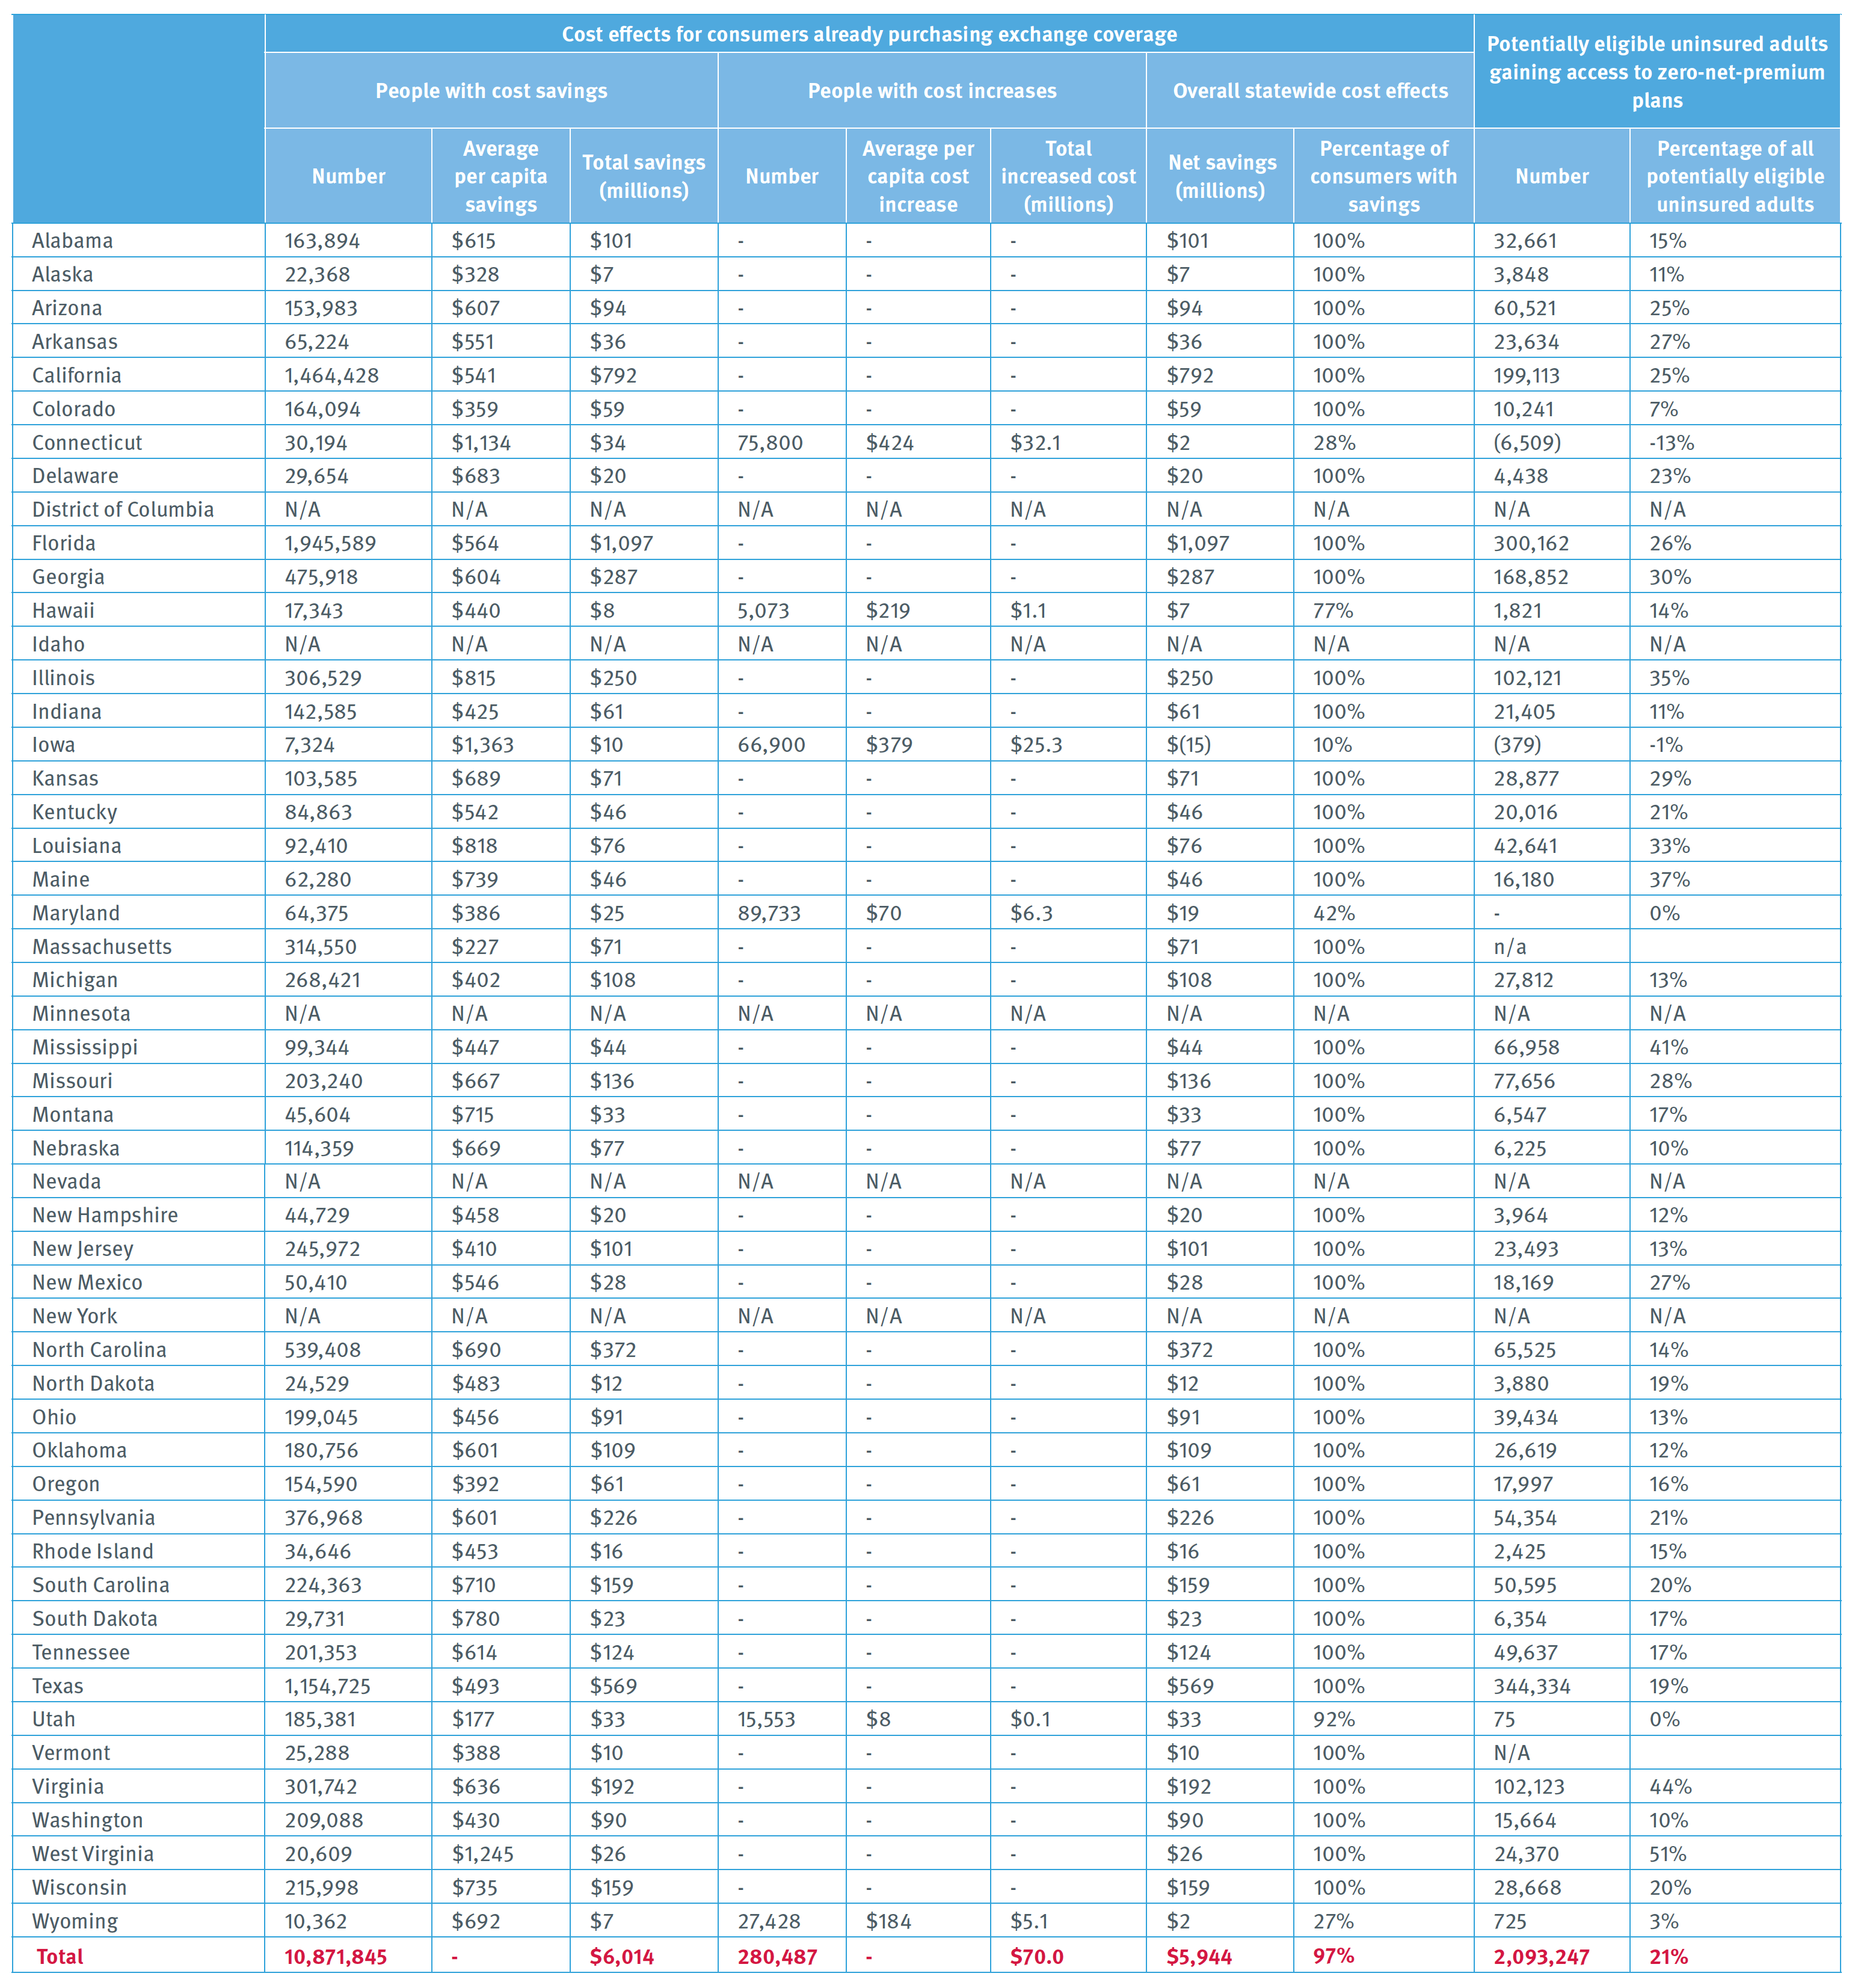
Sources: Analysis of data from the Center for Consumer Information and Insurance Oversight, 2020; the Kaiser Family Foundation, 2020; and the American Community Survey, 2018, IPUMS USA, University of Minnesota, www.ipums.org.
Notes: This exhibit shows the estimated impact on consumers if metal-tier premiums were realigned based on coverage generosity, defined as paid claims estimated for a standard population. Potentially eligible uninsured adults are age 19-64 and meet the requirements for advance premium tax credits (APTCs) involving income and citizenship or immigration status. Someone has access to “zero-net-premium” plans if the lowest-cost bronze plan’s premium does not exceed the individual’s APTC.
Endnotes
[1] Sabrina Corlette, Linda J. Blumberg, and Kevin Lucia, “The ACA’s Effect on the Individual Insurance Market,” Health Affairs 39, No. 3 (March 2020): 436–444.
[2] 2 42 C.F.R. 156.80(d)(2).
[3] Greg Fann and Daniel Cruz, “Fields of Gold: Reaping a Harvest from the ACA,” Axene Health Partners, April 26, 2019, https://axenehp.com/fields-of-gold/
[4] See generally, Jennifer M. Haley and Erik Wengle, Many Uninsured Adults Have Not Tried to Enroll in Medicaid or Marketplace Coverage: Findings from the September 2020 Coronavirus Tracking Survey (Washington, DC: Urban Institute, January 2021), https://www.urban.org/research/publication/many-uninsured-adults-have-not-tried-enroll-medicaid-or-marketplace-coverage; Karen Pollitz, Jennifer Tolbert, Liz Hamel, and Audrey Kearney. “Consumer Assistance in Health Insurance: Evidence of Impact and Unmet Need,” Kaiser Family Foundation, August 7, 2020, https://www.kff.org/health-reform/issue-brief/consumer-assistance-in-health-insurance-evidence-of-impact-and-unmet-need/; Jennifer Tolbert , Kendal Orger, and Anthony Damico, “Key Facts about the Uninsured Population,” Kaiser Family Foundation, November 6, 2020, https://www.kff.org/uninsured/issue-brief/key-facts-about-the-uninsured-population/.
[5] Greg Fann, “The Cost-Sharing Reduction Paradox: Defunding Would Help ACA Markets, Not Make Them Implode,” Axene Health Partners, August 9, 2017, https://axenehp.com/cost-sharing-reduction-paradox-defunding-help-aca-markets-not-make-implode/.
[6] Centers for Medicare & Medicaid Services (CMS), 2020 Marketplace Open Enrollment Period Public Use Files, 2020 OEP State, Metal Level, and Enrollment Status Public Use File (ZIP) (undated) https://www.cms.gov/files/zip/2020-oep-state-metal-level-and-enrollment-status-public-use-file.zip.
[7] Centers for Medicare & Medicaid Services (CMS), 2020 Unified Rate Review Instructions: Rate Filing Justification: Parts I, II, and III (undated) https://www.cms.gov/CCIIO/Resources/Forms-Reports-and-Other-Resources/Downloads/2020-URR-Instructions.pdf.
[8] To develop its risk adjustment formulas, CCIIO estimated that, relative to bronze-level plans with 60% AV, a standard population increases utilization by 15% in 87% and 94% AV silver plans,by 8% in 80% AV gold plans, and by 3% in 70% and 73% AV silver plans. Analysis of tables 1 and 11 in Centers for Medicare & Medicaid Services (CMS), “Patient Protection and Affordable Care Act; HHS Notice of Benefit and Payment Parameters for 2014,” Federal Registrar 78, no. 47 (March 11, 2013): 15410–15541.
[9] According to the above-cited federal open enrollment report for 2020, 45.5% of silver exchange members have incomes below 150% of the federal poverty level (FPL), qualifying for 94% AV plans; 26.7% earn between 150% and 200% of the FPL, receiving 87% AV coverage; 11.6% have incomes between 200% and 250% of the FPL, qualifying for 73% AV coverage; and 16.2% receive baseline 70% AV coverage.
[10] Taking into account both CCIIO’s induced demand assumptions and AV, paid claims would equal the following percentages of covered claims in 60% AV bronze plans:
For 94% AV silver, 108% (1.15 x 0.94 = 1.08).
For 87% AV silver, 100% (1.15 x 0.87 = 1.00).
For 80% AV gold, 86% (1.08 x 0.8 = 0.86).
For 73% AV silver, 75% (1.03 x 0.73 = 0.75).
For 70% AV silver, 72% (1.03 x 0.7 = 0.72).
For 60% AV bronze, 60% (1.0 x 0.6 = 0.60).
The above-noted national distribution of silver-tier exchange enrollees would thus generate, for a standard population, paid claims equaling 96% of average utilization in bronze plans, since (45.5% x 108%) + (26.7% x 100%) + (11.6% x 75%) + (16.2% x 72%) = 96%. Accordingly, the generosity of overall silver coverage is approximately 60% greater than in bronze (0.96/0.60 = 1.6) and 12% greater than in gold (0.96/0.86 = 1.12). Note: The term “covered claims” references the total cost of essential health benefits, including both the plan’s share and the member’s. “Paid claims” references the plan’s share.
[11] Kaiser Family Foundation, Average Marketplace Premiums by Metal Tier, 2018-2020, State Health Facts (undated) https://www.kff.org/health-reform/state-indicator/average-marketplace-premiums-by-metal-tier/?currentTimeframe=0&sortModel=%7B% 22colId%22:%22Location%22,%22sort%22:%22asc%22%7D.
[12] We use information from Colorado’s exchange to fill gaps in federal data about Colorado’s gold-tier enrollees.
[13] Steven Ruggles et al., IPUMS USA: Version 10.0 [dataset] (Minneapolis, MN: IPUMS, 2020), https://doi.org/10.18128/D010.V10.0.
[14] The District of Columbia covers such people through Medicaid. Minnesota and New York provide them Basic Health Program coverage.
[15] For example, if the ratio of silver to bronze estimated paid claims for a standard population was 1.6 but the ratio of premiums between those two metal levels was 1.4, premium misalignment would be -13% ([1.6-1.4]/1.6=0.13). This would indicate that silver premiums were 13% lower, relative to bronze, than what should be charged based on coverage generosity.
[16] For example, if we estimated silver plans’ paid claims for a standard population as 10% above gold and 40% above bronze, realigned silver premiums would be 10% above gold and 40% above bronze premiums.
[17] To determine average out-of-pocket costs, we assume, consistent with medical loss ratio requirements, that 80% of premiums pay covered claims. We then apply both AV and CCIIO’s estimated impact of AV on total utilization to calculate the covered claims paid by consumers and by the plan.
[18] For states that forbid age rating, we do not adjust costs based on age. For Massachusetts, which permits age rating to vary by a 2-to-1, rather than a 3-to-1, ratio, our age adjustment is 66% of the amount calculated under the standard federal age rating curve.
[19] See Linda J. Blumberg, John Holahan, Michael Karpman, and Caroline Elmendorf, Characteristics of the Remaining Uninsured: An Update (Urban Institute, July 2018), https://www.urban.org/sites/default/files/publication/98764/2001914-characteristics-of-the-remaining-uninsured-an-update_2.pdf.
[20] Other examples of our simplifying assumptions include: factoring in only on-exchange enrollment in determining the distribution of silver qualified health plan members by AV level, disregarding the impact of American Indian/Alaska Native CSRs, and assuming that members in 70% and 73% AV silver plans will shift to 80% AV gold when premium costs plus average out-of-pocket costs are lower in gold, even though many have below-average out-of-pocket costs and many do not change plans when required to protect their financial well-being. The latter consideration suggests that exchanges should give consumers the option to use a default renewal protocol through which, if they do not select a plan and their current plan is certain to cost them more than another available option, they are shifted to the plan that would be less expensive for them. That analysis of plan expense would take into account both premium and out-of-pocket costs. Consumers electing this option would receive advance notice before the plan shift occurred and opportunities to opt out and return to their prior plan. Such a mechanism could be useful under any circumstances, but it would be particularly important when market dynamics change significantly from one plan year to the next.
[21] In Alaska, gold premiums fall by 0.45%, which Exhibit 2 displays as a 0% change.
[22] Much research identifies unaffordable cost as a major barrier to individual market enrollment. See, Munira Z. Gunja and Sara R. Collins, “Who Are the Remaining Uninsured, and Why Do They Lack Coverage? Findings from the Commonwealth Fund Biennial Health Insurance Survey, 2018,” The Commonwealth Fund, August 2019, https://www.commonwealthfund.org/publications/issue-briefs/2019/aug/who-are-remaining-uninsured-and-why-do-they-lack-coverage.
[23] Amy Finkelstein, Nathaniel Hendren, and Mark Shepard, “Subsidizing Health Insurance for Low-Income Adults: Evidence from Massachusetts,” American Economic Review 109, no. 4 (April 2019): 1530–1567.
[24] CMS. 2020 Unified Rate Review Instructions, op cit.
[25] For example, “Anthem Response to BOI Questions Sent 7.9.2020,” https://filingaccess.serff.com/sfa/search/filingSummary.xhtml?filingId=132385538#.
[26] Greg Fann, “Focused ACA Rate Review: Tangible Ways for States to Address Metalball,” Axene Health Partners (undated) https://axenehp.com/focused-aca-rate-review/.
[27] National Center for Health Statistics, Centers for Disease Control and Prevention (CDC), “Summary Health Statistics: National Health Interview Survey, 2018,” accessed October 15, 2020, https://ftp.cdc.gov/pub/Health_Statistics/NCHS/NHIS/SHS/2018_SHS_ Table_P-9.pdf.
[28] This raises risk adjustment payments by 8.4% (0.12 x 0.70 = 0.084).
[29] The one exception involves very high-cost consumers, with annual claims that exceed $1 million. For such extreme outliers, all states’ risk adjustment systems make payments. In this one way, risk-adjustment systems are zero-sum nationally, rather than within each state.

Stan Dorn
Director of the National Center for Coverage Innovation and Senior Fellow, Families USA
Greg Fann, FSA, FCA, MAAA
Consulting Actuary, Axene Health Partners, LLC
Hannah Markus
Strategic Partnerships Coordinator, Families USA
For more information contact Greg Fann at (951) 542-2828 or by email at greg.fann@axenehp.com.