
Most of us know by now that the mathematical results of input changes in formulas associated with the Affordable Care Act (ACA) are not intuitive. Since its 2014 implementation, the most favorable impact (beginning in 2018) on ACA markets has been President Trump’s October 2017 decision to defund cost-sharing reduction (CSR) payments. The paradoxical benefit1 of reduced funding resulting in more funding is not that hard to understand, but it does require doing some math and graphical visualization is helpful. Complicating matters, the decision itself was based on a legal recommendation but the external reality was that it had been used as a political bargaining tool, and not one on the side of benefitting ACA markets.
2018 Changes
Most of the reporting on the CSR defunding missed the mark, but some commentators supportive of the ACA were more diligent and actually recommended the change. Highlighting the non-intuitiveness of ACA math, the Congressional Budget Office (CBO) got this one right but believed it would take the insurance industry (who, last I checked, employed and consulted with actuaries) a couple of years to figure things out. It took a few days or weeks.
“CBO and JCT expect that insurers in some states would withdraw from or not enter the nongroup market because of substantial uncertainty about the effects of the policy…By 2020, though, insurers would have observed the operation of markets in many areas under the policy and CBO and JCT expect that more insurers would participate, so people in almost all areas would be able to buy nongroup insurance…By CBO and JCT’s estimates, the number of people receiving subsidies for nongroup health insurance would increase under the policy in most years. In particular, because tax credits would increase and gross premiums for plans other than silver plans in the marketplaces would not change substantially, many people with income between 200 percent and 400 percent of the FPL would, compared with outcomes under the baseline, be able to pay lower net premiums for insurance that pays for the same share (or an even greater share) of covered benefits. As a result, more people would purchase plans in the marketplaces…”
The Democratic Whip who commissioned the CBO review did not interpret the study as benefitting markets, indicating it would “cause premiums to rise 25% and…in some parts of the country, it would lead to there being no insurance options left on the individual market”. He did not properly understand ACA math or what the report concluded.
2020 Changes
The 2020 Notice of Benefit and Payment Parameters (NBPP) finalized on 4/18/19 includes two ACA formula changes that have attracted attention. They are distinct changes, and enrollees are primarily impacted by one and not the other. The first reduces “user fees” by 0.5% which directly reduces premiums; this aligns with reduced funding for some of the activities that were supported by user fees. The second is a technical change in an index which reduces premium subsidies. After reading the Centers for Medicare and Medicaid Services’ press release, the accompanying fact sheet, and various commentaries on the changes, many people are confused and asking “What does this mean? How does this impact me?”. The reality is “not much” but it warrants a discussion.
To understand the 2020 changes in context, it’s useful to consider the magnitude relative to the 2018 changes and the resulting impact in 2018 on net premiums and markets.
| CSR Defunding: ‘Winners’ and ‘Losers’ | |||
| Consumers | Insurers | Taxpayers | |
| Myth | Losers | Losers | Winners |
| Reality | Winners | Winners | Losers |
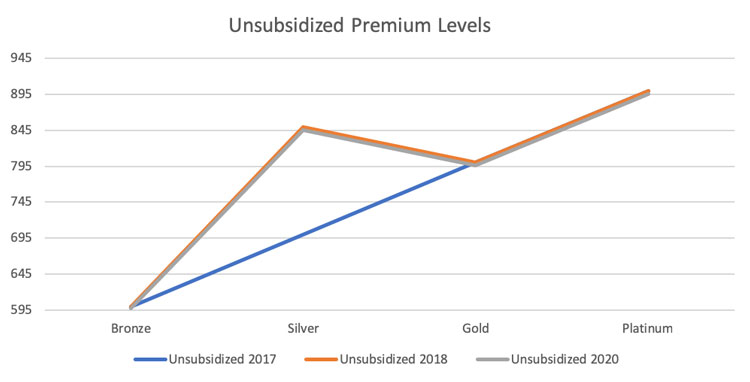
The 2018 change increased Silver premium rates and boosted premium subsidies. The 2020 change reduces premium rates and lowers premium subsidies. The numbers in the table below are reasonable for purposes of explaining dynamics but are not representative of any specific marketplace.
| Premium Levels with CSR Funding (2017) | ||||
| Bronze | Silver | Gold | Platinum | |
| Individual 1 (Unsubsidized Premium) | 600 | 700 | 800 | 900 |
| Premium Subsidy | 500 | 500 | 500 | 500 |
| Individual 2 (Subsidized Permium) | 100 | 200 | 300 | 400 |
| Premium Levels without CSR Funding (2018) | ||||
| Bronze | Silver | Gold | Platinum | |
| Individual 1 (Unsubsidized Premium) | 600 | 850 | 800 | 900 |
| Premium Subsidy | 600 | 650 | 650 | 650 |
| Individual 2 (Subsidized Permium) | 0 | 200 | 150 | 250 |
| Premium Levels without CSR Funding (2020) | ||||
| Bronze | Silver | Gold | Platinum | |
| Individual 1 (Unsubsidized Premium) | 597 | 846 | 796 | 896 |
| Premium Subsidy | 597 | 636 | 636 | 636 |
| Individual 2 (Subsidized Permium) | 0 | 210 | 160 | 260 |
Making Sense of It All
Graphically, it’s easy to see the 2020 gross premium impact relative to 2018. The 2018 change from the blue line to the orange line only impacted silver plans. Every unsubsidized enrollee (in most states) should have exited Silver plans in 2018. Many enrollees remained in Silver plans, prompting discussion of discontinuing automatic re-enrollment. The 2020 change from the orange line to the gray line represents a savings, but it is minimal.
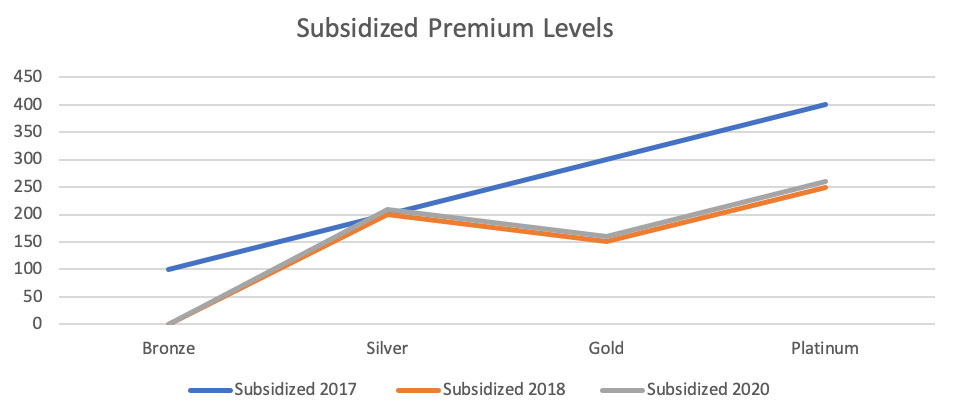
For subsidized enrollees, the 2020 increase in net premiums is a small offset to the 2018 change. Enrollees utilizing CSR benefits received no benefit from the 2018 change, and they will have a small premium increase in 2020.
The 2020 changes, when measured alone, are a ‘win’ for taxpayers and unsubsidized enrollees, and a ‘loss’ for subsidized enrollees. As discussed, the 2020 changes are very small relative to 2018. After incorporating the 2020 changes, the cumulative winners and losers are still the same as they were in 2018, with a few caveats on previously unimpacted consumers. Unsubsidized enrollees, unimpacted in 2018 other than Silver plans being removed as an appropriately priced option, now benefit from lower premiums. Enrollees receiving CSR benefits, unimpacted by the 2018 changes, will pay more in net premiums. Using numbers in our example, it’s cumulatively a $10 additional monthly cost for enrollees seeking a CSR benefit, otherwise a $4 benefit for unsubsidized enrollees and a $140 benefit for subsidized enrollees. Bottom line, big changes happened in 2018. The 2020 NBPP changes? Not so much.
| Cumulative ‘Winners’ and ‘Losers’ | |||
| Consumers | Insurers | Taxpayers | |
| Myth | Losers | Losers | Winners |
| Reality | Winners | Winners | Losers |
What About 2019?
It is worth noting that we skipped a year. After the favorable changes in 2018, many carriers returned to ACA markets in 2019 after mass exits in 2017 and 2018. The ACA math renders Increased competition harmful for subsidized enrollees. This dynamic is beyond the scope of this article, but if you’re puzzled why ACA rates are lower in 2019 and it doesn’t match any of your friends’ experience, you’re not alone and that rationale is discussed here.
The Real 2020 Impact
The resulting changes from the 2020 NBPP are immaterial in the ACA grand scheme. Adding to prior positive developments, there will be weighty market changes in 2020 unrelated to the NBPP, but results will vary by state. ACA markets are now stronger than they have ever been, and they should be even more robust in the future. The CSR defunding action was a gift which essentially increases subsidy funding from Silver level coverage to near Platinum level coverage. For reasons beyond the scope of this article but discussed here and here, the favorable changes modeled in the ‘Subsidized Premium Levels’ graph have not fully materialized in some states. This inaction is not the fault of the federal government; this is on states and their respective insurance companies who are inexplicably not fully leveraging the CSR defunding dynamic. More states will do so in 2020. In a few months, I promise you that we will be talking about real impact to 2020 markets, not user fees and technical index changes.
While I’m a technical numbers guy and not a political expert, I do find it fascinating how poorly ACA market performance aligns with politically-based expectations. The recent Trump-induced market improvements have improved the ACA’s long-term sustainability. Untapped opportunities are abundant through increased subsidies via appropriate pricing and Section 1332 waivers (sometime portrayed as undermining markets). We should expect states to take advantage of new opportunities and anticipate ACA markets being stronger in 2020. If you don’t believe me, and I mean this respectfully, it’s only because you haven’t taken the time to understand ACA math…rest assured you have a lot of company.
1 Example in https://axenehp.com/wp-content/uploads/2017/08/ahp_inspire_20170809.pdf is referenced throughout this article. It is recommended background reading.
About the Author

Any views or opinions presented in this article are solely those of the author and do not necessarily represent those of the company. AHP accepts no liability for the content of this article, or for the consequences of any actions taken on the basis of the information provided unless that information is subsequently confirmed in writing.