
Then a left will take you to the interstate
But a right will bring you right back here to me
– Good Directions, by Billy Currington
I recently heard about a song collaboration between Ozzy Osbourne and Post Malone. I remember this only because I also heard a random but insightful observation regarding the collaboration. Everyone over 30 was asking, “Who is Post Malone?”. Everyone under 30 was asking, “Who is Ozzy Osbourne?”. That struck me as accurate, perhaps because it was personally, anecdotally true.
If there is a generational actuarial parallel, I suppose it’s…give me a minute, I’m literally making this up as I write…it’s about the research paper “The Decision Science Impact on the Underwriting Cycle”, with actuaries over 30 asking, “What is Decision Science?” and actuaries under 30 asking, you guessed it, “What is an Underwriting Cycle?”.
The once pseudo-sacred “underwriting cycle” has fallen out of the common nomenclature at industry conferences and inside the walls of health insurance company buildings. But if you ask some of your seasoned associates about it, they will have some stories to share.
The Health Insurance Underwriting Cycle
Historically, health insurers were generally subject to an underwriting cycle of roughly six years. From the late 1960s to the early 1990s, market-level financial results in the insurance industry demonstrated a regular pattern of alternating periods of underwriting gains and losses. A repeating pattern of six-year cycles with three years of gains followed by three years of losses emerged. The basic theory of the underwriting cycle is that insurers cyclically adjust price levels in recognition of competing goals of growth and profitability. The common explanation is that as market profitability rises, insurers begin pricing more aggressively to gain market share, and competitors follow suit to protect their own market share. Lower prices ultimately lead to losses, prompting insurers to raise prices again to profitable levels. The entire cycle process lasts about six years, and then the cycle repeats itself.
I recall 1990s-era discussions with leading salespeople quizzing me about ”where we were on the cycle” as they tried to understand and project the short-term competitive environment. As the cycle was never exactly six years, insurers’ assessment of current conditions shaped the aggressiveness of pricing decisions and other strategic deliberations. When discussed today, multi-year cyclical patterns are usually more related to broader financial management considerations including surplus level optimization and regulatory Risk-Based Capital concerns.
While there is less evidence of recent annual patterns conforming to a cycle relative to prior years, the fundamental timing challenges of health insurance remain. Insurers develop premium rates for policies several years before they know how underlying claims will materialize. Premiums are developed months before they take effect, sometimes earlier to allow for regulatory approval, and generally guaranteed on an annual basis. After the coverage period expires, it is usually about a year before all claims are paid. As future premiums are predicated on prior claim levels, there is a significant lag time to account for unexpected (either positive or negative) changes in health care costs. Accordingly, required pricing adjustments take time to recognize and implement, and periods of sustained gains or losses can last multiple years. Insurers test variations of reasonable scenarios to assure adequate capitalization to weather multiple years of material losses.
Early ACA Patterns
The Affordable Care Act (ACA) reset the individual market in 2014 with new rating rules and an income-based premium subsidy formula that changed the enrolled population. An early cyclical pattern, or at least a very strong correlation, has developed in the first six years. The Kaiser Family Foundation has compiled reports which demonstrate tight alignment of insurer participation and financial results (measured by nationwide medical loss ratios).
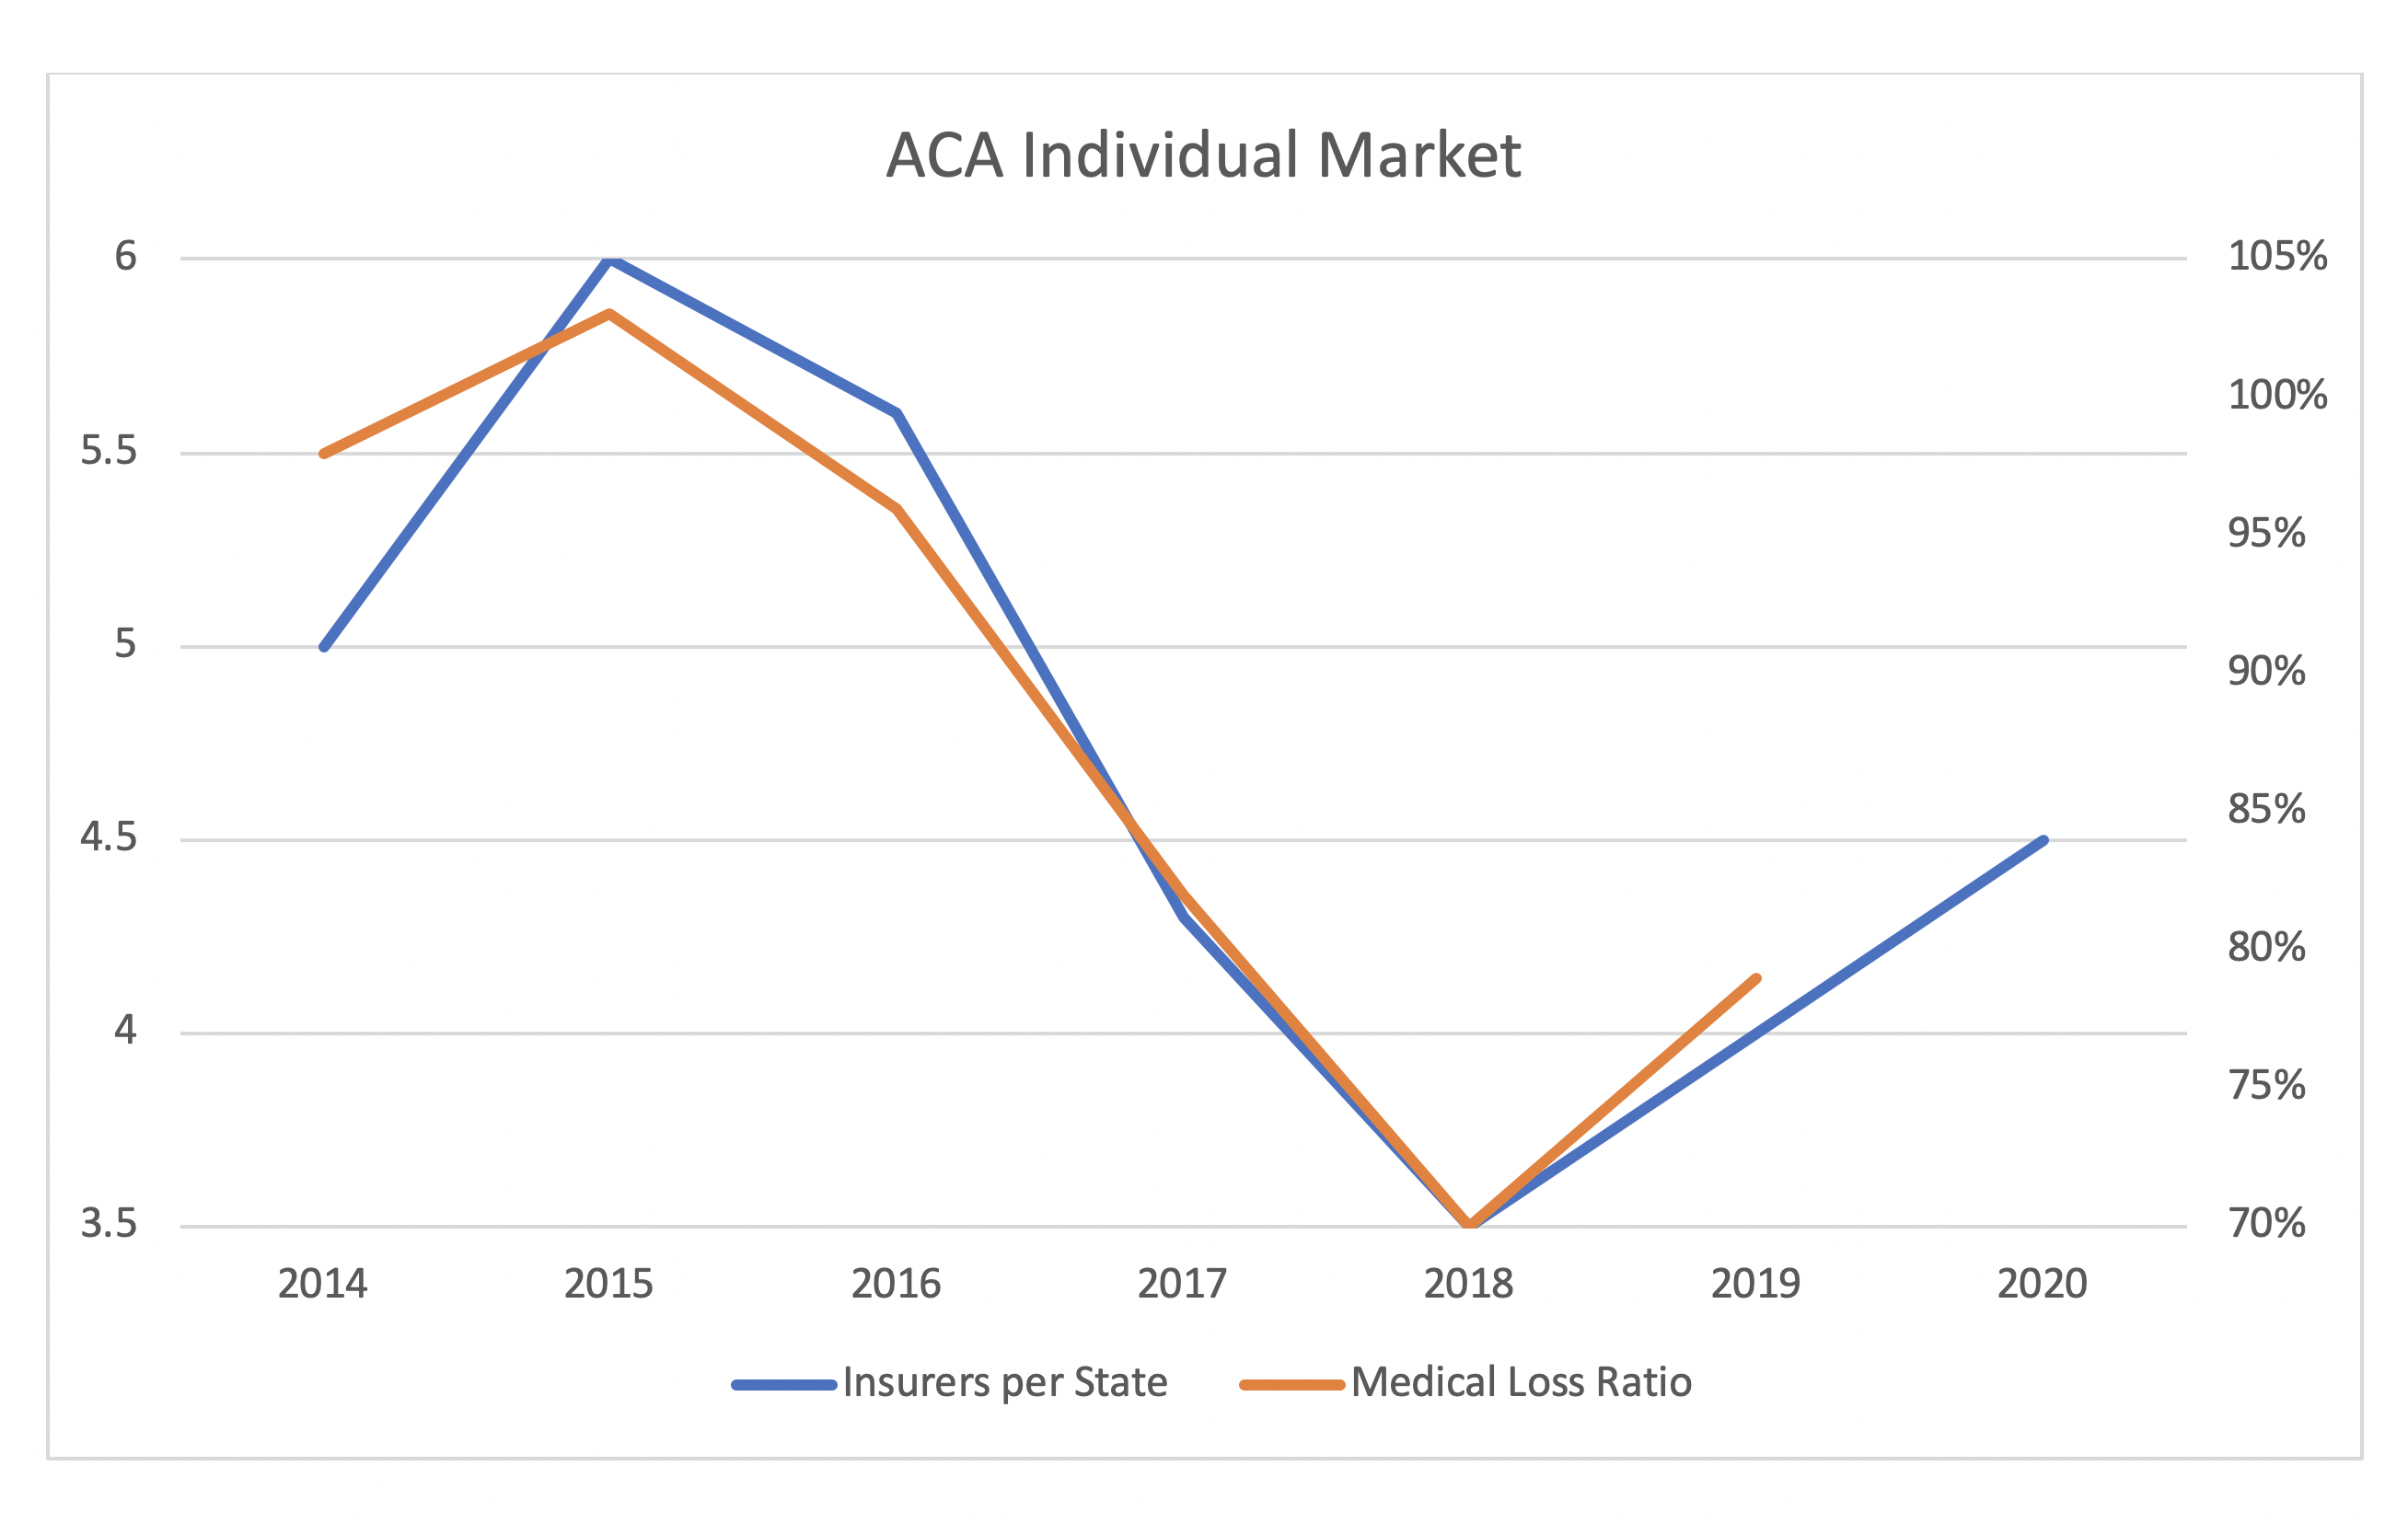
While this alignment should continue in 2020, it is too early to confidently determine longer-term patterns. There is reasonable causation here; correlation is not mere coincidence. Poor financial results through 2016 led to market exits through 2018; the better financial results, which were clearly apparent in 2018, drew insurers back to markets in 2019 and 2020, and perhaps 2021. The timing lag is suggestive of general accordance with a six-year pattern.
Like everything else in the ACA individual market, premium subsidy dynamics help explain results. Subsidies are calibrated based on the 2nd lowest-cost silver plan in each market. As insurers exit markets and fewer silver plans remain, premium subsidies increase, and markets are more favorable to consumers.
Conversely, “an increase in insurer participation alone creates a bias for compressed premium subsidies”. An increasing number of insurers in a marketplace also enhances the potential lionfish risk with a presence of low-cost plans; this threat is understood and “some savvy state exchanges have recognized this dynamic and deliberately and perhaps controversially avoided allowing low-cost plans on their platform”. Recent financial results have been strong and could entice more insurers; greater insurer attraction could cyclically lead to a crowded marketplace with the same recurring challenges.
Monitoring Developments
As the ACA’s 10th anniversary passed, a common actuarial refrain was “If you have seen one state ACA market, you have seen one state ACA market”. I have expanded that to “If you have seen one state ACA market in one year, you have seen one state ACA market in one year”. While cumulative nationwide data is useful to interpret general conclusions, there are various underlying details at the state level.
Notably, states are at different stages of reaching market equilibrium in terms of achieving appropriate metal level pricing relationships. After a partial response in 2018, the market movement toward equilibrium stagnated in 2019 and 2020. Markets will continue to improve and potentially attract more insurers during the transitional phase, which could last until “the end of the coming decade”. A gradual but steady market improvement could disrupt nationwide measures of an otherwise smoother pattern of results.
Will we see a new form of a six-year cycle in ACA markets? The same timing patterns of receiving data, analyzing results, filing premium rates, and implementing new products remain, so a six-year pattern is a reasonable starting point. However, the new subsidy dynamics that reshaped the market in 2018 impacts the timing course. The short history suggests a lagged response of insurer market entry as financial results improve. If financial results deteriorate, we may see insurer exits again. Complicating these matters is the unknown timing of various states to reach market equilibrium, as some are considering a faster pace through direct action in 2021.
At a minimum, stakeholders should recognize the correlation of profitability and insurer market participation. This is not merely traditional competitive dynamics. As insurers return to markets, competitive pricing does not provide subsidized consumers a better value. It only compresses premium subsidies and raises the net cost of consumers’ current coverage. This naturally results in enrollment losses, which leads to higher morbidity, financial losses and insurers exiting markets. Of course, this implies that premium subsidies are boosted again, and the ACA cycle may begin to repeat.
About the Author

Any views or opinions presented in this article are solely those of the author and do not necessarily represent those of the company. AHP accepts no liability for the content of this article, or for the consequences of any actions taken on the basis of the information provided unless that information is subsequently confirmed in writing.