
Any views or opinions presented in this article are solely those of the author and do not necessarily represent those of the company. AHP accepts no liability for the content of this article, or for the consequences of any actions taken on the basis of the information provided unless that information is subsequently confirmed in writing.
The story of consumer value in the Affordable Care Act (ACA) individual marketplaces echoes one of the great epochs of our nation’s history where a sense of manifest destiny culminated in a quest to unite the coasts in the mid-1800s, ultimately resulting in the incorporation of Texas, New Mexico, and California into the union. During 2022, the greater Southwest is again experiencing an expansion of sorts, however, this time a Gold Rush in New Mexico rather than in California has ignited legislators and regulators to focus on expanding premium alignment[1] efforts from sea to shining sea. Pennsylvania, the birthplace of American independence, can also proudly claim to be the birthplace of the “Silver Bulletin”[2] framework, a rate guidance bulletin[3] for the individual marketplace that has served as the foundational document ratifying the approach to greater ACA compliance and consumer affordability. In 2022 we saw New Mexico implement the rational consumer version of the Pennsylvania Silver Bulletin[4], expanding the concept of premium alignment to incorporate an even stricter interpretation of ACA pricing rules that further enhances affordability by moving the market to the expected ultimate equilibrium predicted long ago by the Department of Health and Human Services (HHS) in 2015[5].
Texas has also decided to implement its own version, the Texas Two-Step, mandating induced demand factors and then its own unique CSR Defunding factor for 2023[6], making Texas the third state to implement a version of the Silver Bulletin. Although California has to date resisted premium alignment efforts, new leadership from the State of Independence[7], may signal that an impending Gold Rush enhancing the wealth of its citizens may once again unite the great states of Texas, New Mexico, and California, as the leading states in consumer value that could inspire the industry to correct anti-consumer pricing abuses[8] that have plagued marketplaces across the country.
With that backdrop, I present the 3rd annual ACA consumer value state rankings list which has been created to help discover meaningful differences between states that would highlight success stories that could be emulated by other states with the goal of improving value for ACA consumers. Since the inception of these value rankings[9][10], an increasing number of states have implemented improvements to their markets targeting ACA compliance that leads to better consumer outcomes. At the same time, through the passage of the American Rescue Plan (ARP), individual market consumers have had access to enhanced premium subsidies which has resulted in a higher percentage of subsidized consumers on the exchange marketplaces[11] (over 90% of exchange enrollees are now subsidized).
Considering the current state of the market, I have revised this year’s methodology to reflect the greater proportion of subsidized enrollment and the improvements in consumer affordability and product choice. It is a fun exercise that tries to simplify some of the complexities of the ACA[12] to which further reading on the topic is highly suggested. Throughout the article, links are provided which will explain important ACA dynamics[13] necessary to understand the following assessments. Please read for further detail. Otherwise, the remainder of this article assumes the reader has knowledge of the non-intuitive nature of how subsidies are calculated in ACA markets.
The highlights of 2022 return to the Southwest and is the tale of three states.
- New Mexico: The Silver Bulletin Reaps a Golden Harvest. New Mexico has taken the Joe Pesci Option[14] and is now ranked #1 in ACA consumer value across the nation with North Dakota falling to #2 in the power rankings:
The New Mexico Office of Superintendent of Insurance (OSI) implemented an individual market pricing guidance bulletin for the plan year 2022 that has reshaped its individual market, creating cost savings for a large portion of subsidized enrollees, and incentivizing non-CSR[15] eligible subsidized consumers to select richer benefits. The New Mexico OSI has created a blueprint for other states to follow in accomplishing goals of ACA rating compliance, improved market affordability and reducing the underinsured risk that is widespread in ACA markets across the country[16]. In short, New Mexico has Made Rate Review Great Again[17].
The improvements in value can largely be attributed to the change in the relationship between the Gold to Silver premium ratio from the plan year 2021 to 2022. In 2021, that ratio was equal to 99% which dropped to 86% in 2022. This drop in the relationship of Gold premiums to Silver premiums (inclusive of the benchmark plan), resulted in dramatic improvements in affordability and access to richer benefits in the New Mexico individual market. To see the changes in affordability for a typical subsidized consumer making more than 200% of the FPL, please see Exhibit 1 below.
Exhibit 1[18]: New Mexico Individual Market Affordability Changes 2021 to 2022

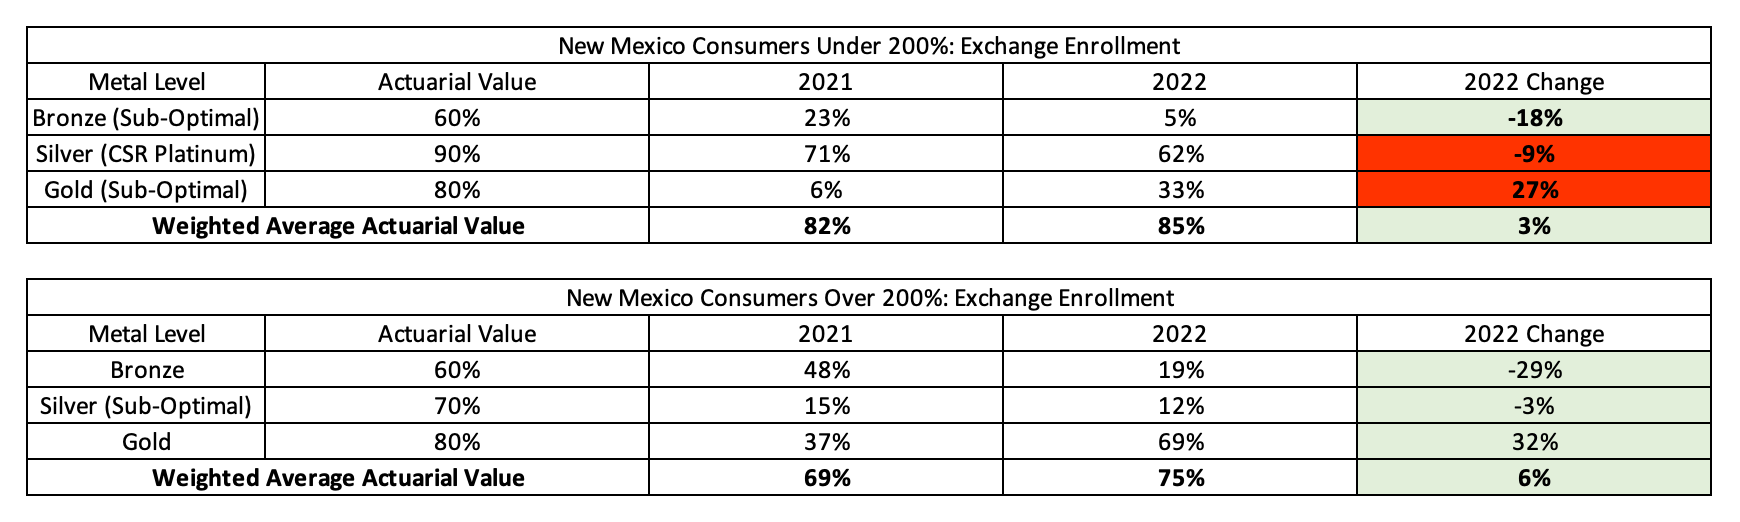
However, despite state action predicated on the rational consumer assumption, consumer behavior did not respond in a fully rational way. Consumers making under 200% of the FPL went from selecting Silver plans 71% of the time in 2021 to 62% of the time in 2022. Given that consumers under 200% of the FPL receive Platinum benefits through Silver variant plans, selecting a non-Silver metal level would be considered sub-optimal. At the same time, it should be noted that many of these consumers now have access to free Gold coverage which may in the end be the better deal for some consumers (more so for CSR-87 consumers) despite exposing them to greater financial risk. Further, other consumer motivations may exist such as access to broader networks at cheaper prices through Gold plan designs but for simplicity, we maintain Gold selection as sub-optimal. In contrast to the under 200% of the FPL consumers, consumers making over 200% of the FPL greatly improved in benefit richness going from 37% selecting Gold plans in 2021 to 69% selecting Gold plans in 2022.
Exhibit 2 below shows the change in enrollment for these two categories of consumers by metal tier. In the first column, the “sub-optimal” metal choices are identified and the last column is highlighted in green when enrollment shifts in the “optimal” direction and red when the enrollment shifts in the “sub-optimal” direction. Bronze plan selection dramatically decreased for all subsidized enrollees.
Exhibit 2[19]: New Mexico Metal Level Selection Changes by Income Level 2021 to 2022
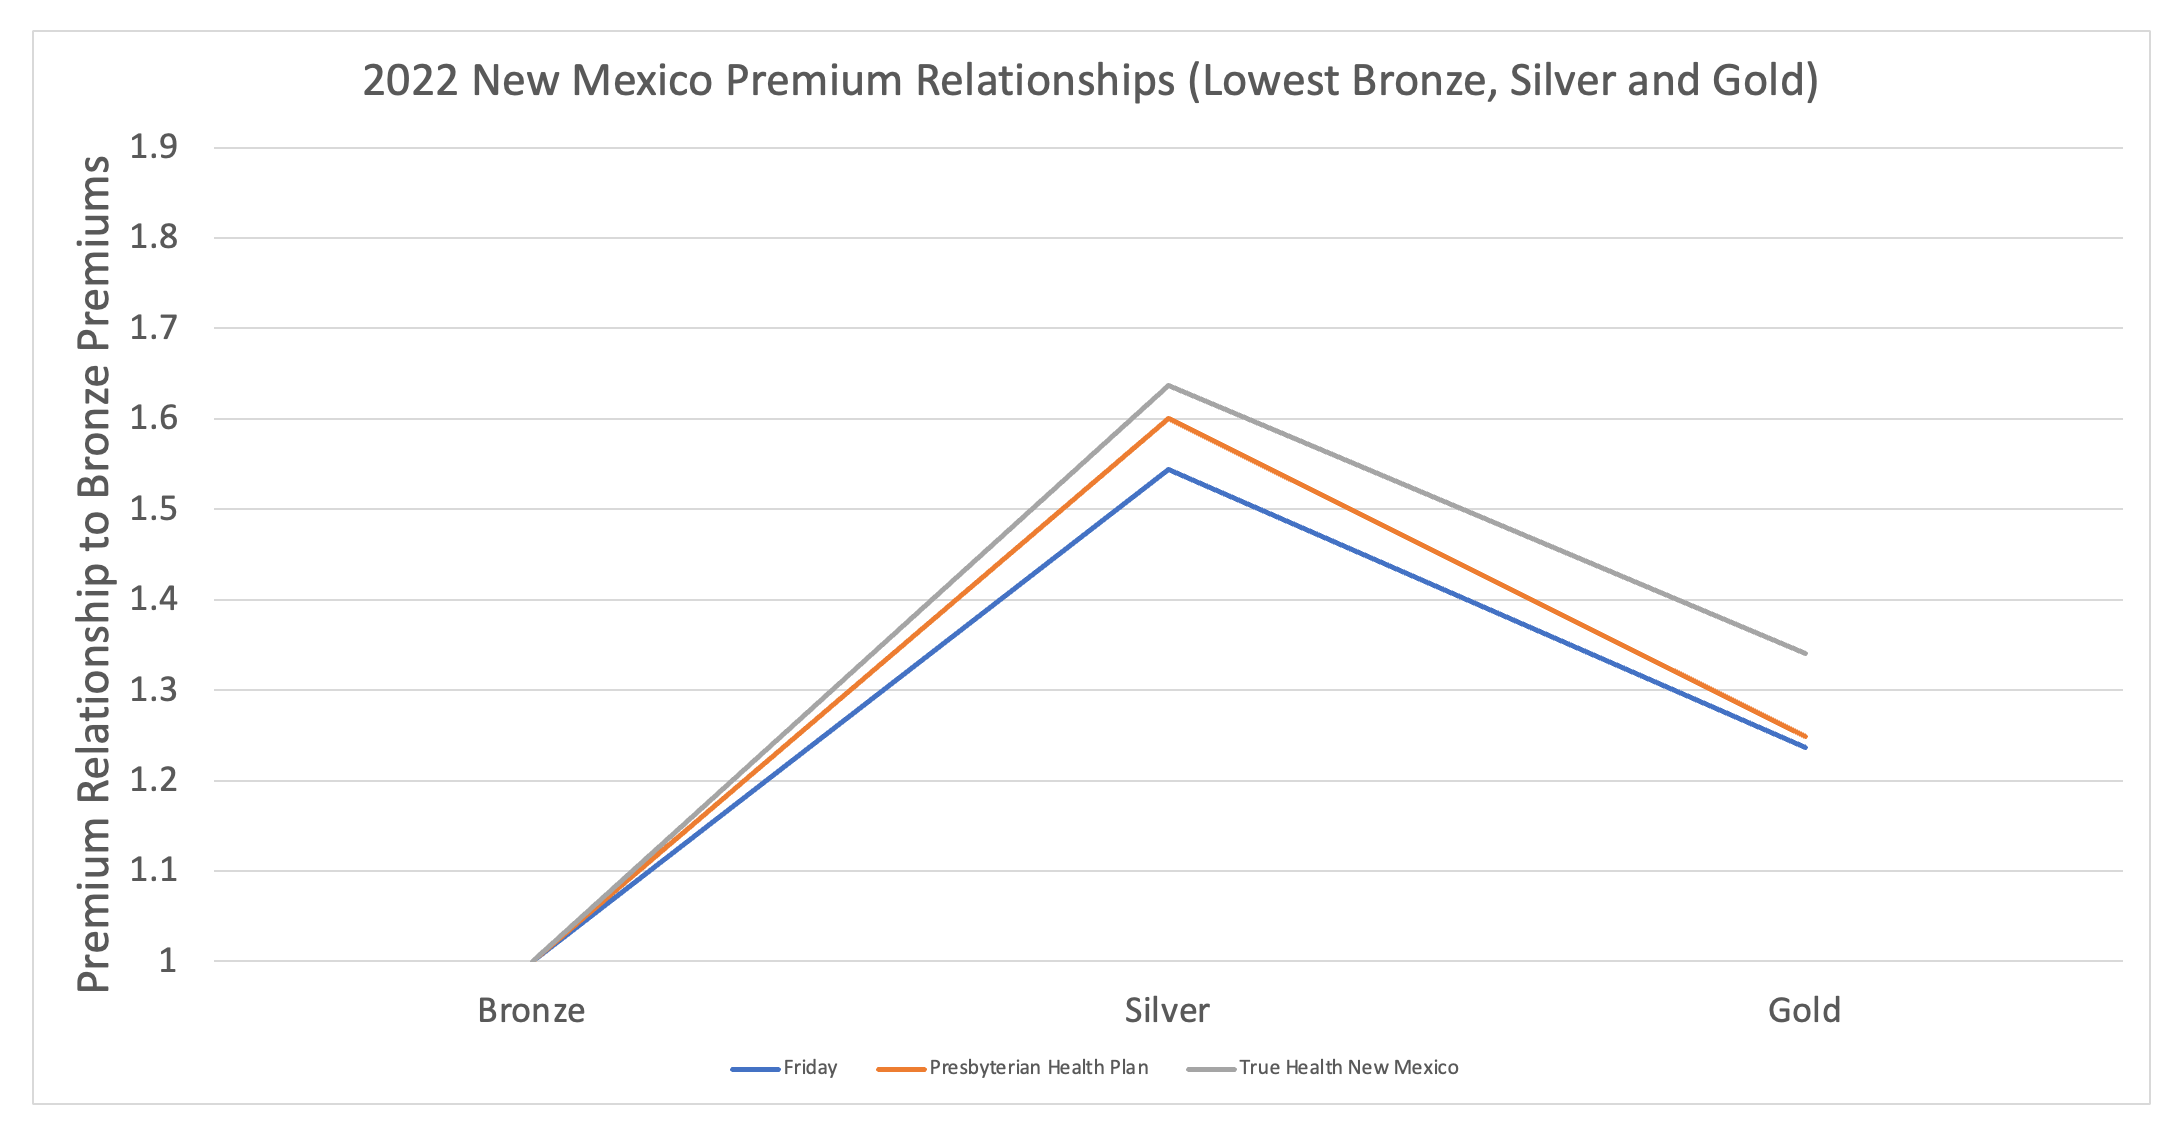
It’s important to note that these changes have occurred in year 1 of implementing this new rating dynamic. Consumers typically take 2-3 years[20] to respond to these types of changes and the New Mexico state-based exchange can work to make the optimal benefit decisions more plainly understandable to those consumers shopping. Bottom line, the pricing dynamics have been put in place to optimize consumer benefits and assure ACA rating compliance. I expect New Mexico consumer behavior to improve over time which will further cement New Mexico as the leading state in ACA consumer value. To highlight the compliance issue, the following graph will be replicated for the three states compared in this summary of plan year 2022[21]. The graph shows the premium factor relationships between the lowest Bronze, Silver and Gold with Bronze starting at 1.0 and the other metal levels presented as a factor of the Bronze premiums. The New Mexico rating rule has standardized these relationships which can be seen using the three carriers that offer all three metal tiers in the market as shown in Exhibit 3.
Exhibit 3[22]: 2022 New Mexico Metal Level Premium Relationships
- Texas: The Texas Two-Step is Poised to Preserve Consumer Value. Texas is home to the biggest market improvement in consumer value for 2022, climbing 25 spots to reach #12 in the nation…and they are just getting started.
The 2022 Texas market is an apparent case of a carrier (or multiple carriers) strictly interpreting ACA rating rules and creating great consumer value but doing so without regulatory oversight. However, unlike other states who have seen affordable Gold plans come and go[23] due to competitive pressures, Texas has put into place regulatory action to bring all carriers in line with ACA pricing rules by implementing focused rate review[24]. Texas, a state that boasts of once being its own country and a state not known for championing the ACA, has become an unlikely source for promoting ACA rating compliance[25]. In an industry environment where political posturing is commonplace[26], it is a breath of fresh air to see a state recognize that proper enforcement of a now decades-old law is not an ideological endorsement of the law’s philosophical tenets but rather a civic duty of those charged with implementing the law for the good of the residents in their state.
To get a sense of the current lack of pricing parity in Texas and why focused rate review is needed to preserve and enhance consumer value going forward, see Exhibit 4 below, which replicates the New Mexico Exhibit 3. Exhibit 4 is a sharp contrast to Exhibit 3, reflecting an objectively inappropriate level of disparity between carriers. Texas is not unique in these disparities and the actuarial community, those tasked with adhering to and regulating the single risk pool requirements set forth by the ACA, has failed to self-correct pricing violations, forcing political actors and bureaucrats to step in and do the job that would normally fall to actuaries.
Exhibit 4: 2022 Texas Metal Level Premium Relationships
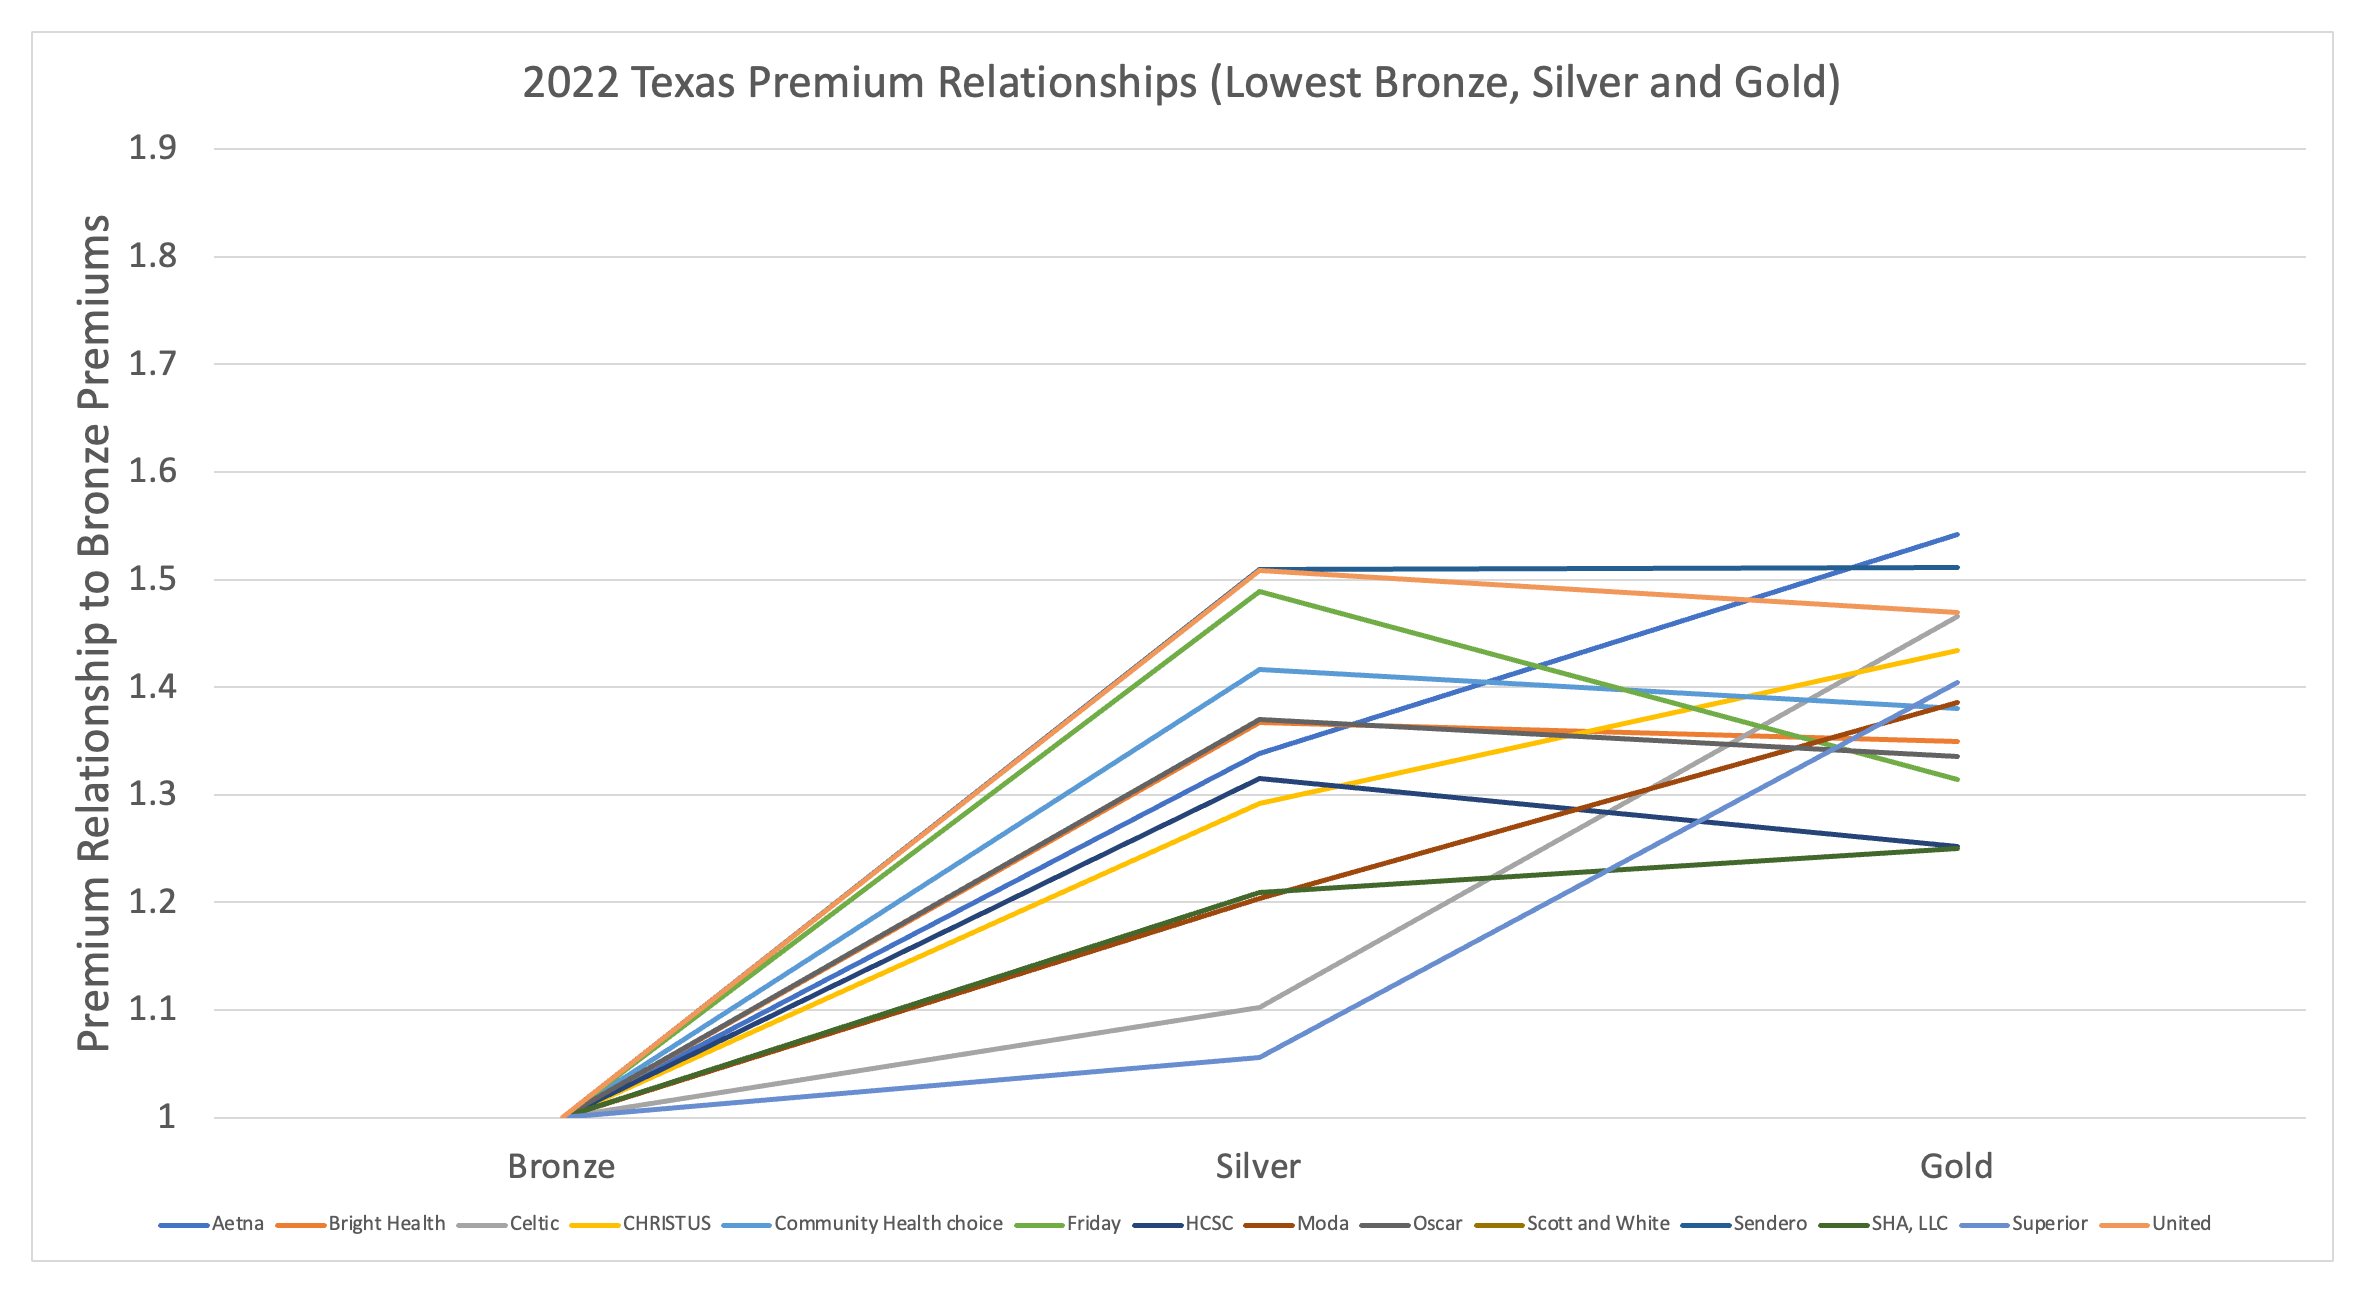
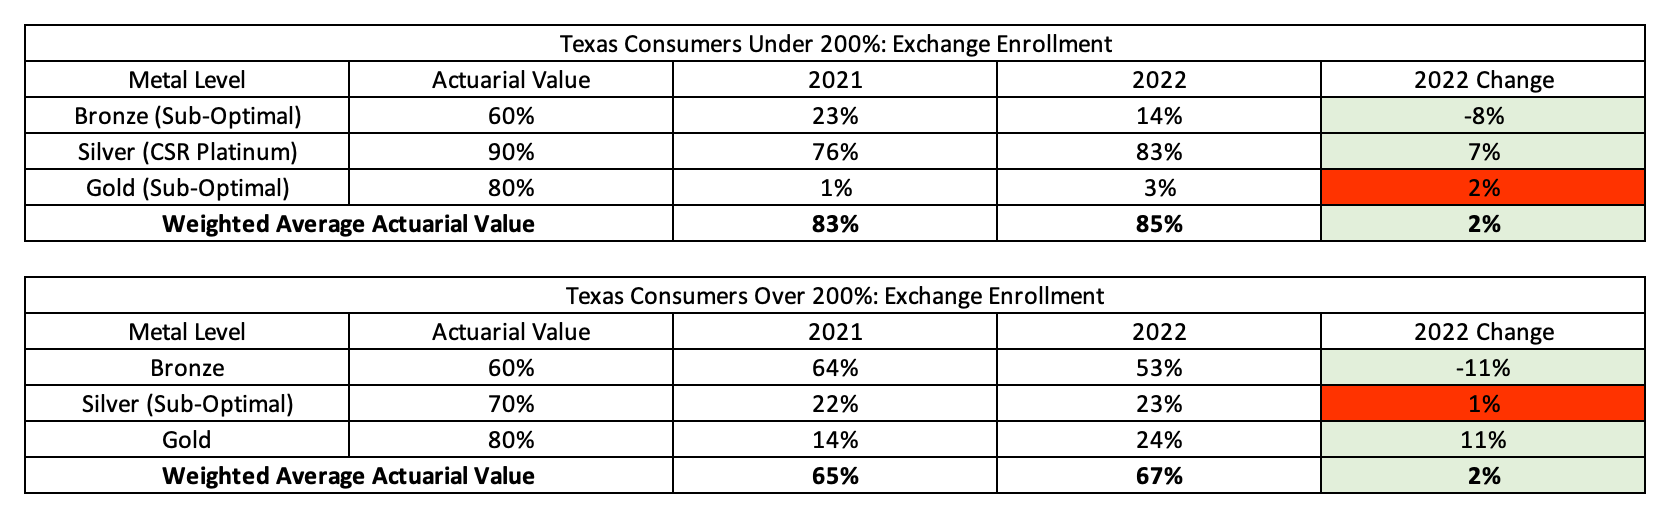
Exhibit 5 shows the current enrollment patterns on the Texas exchange that replicates the New Mexico Exhibit 2 above. 2022 saw general improvements over 2021 and 2023 is expected to get even better for Texas consumers. The biggest difference between Texas and New Mexico is those consumers over 200% of the FPL. In New Mexico, these consumers have an average actuarial value of 75% compared to the average of 67% in Texas. These differences should minimize in 2023 as focused rate review is implemented in the Texas marketplace.
Exhibit 5: Texas Metal Level Selection Changes by Income Level 2021 to 2022
- California: Pay No Attention to the Man Behind the Curtain. California continues its slide into worsening ACA consumer value falling 14 spots to #35 in the nation.
California is a state home to the glamour, glitz and facade of Hollywood, a state known for its great beauty and outsized voice on the national stage. It should come as no surprise then that California views itself as a leader in the implementation of one of the most impactful healthcare legislative efforts in recent memory, the ACA. For instance, read any local publication statements about Covered California[27], the largest state-based exchange in the country, and you would assume consumers in California have nation-leading ACA affordability and that California health plans experience tighter levels of regulatory oversight than their counterparts in other states. In fact, you can ask the health plans themselves, who in speaking about the outgoing executive director of Covered California, Peter Lee, praised his toughness towards insurance companies by stating “there was no way to game the system. The only way to compete was to work on your costs and your quality and the access that the members had.”[28]
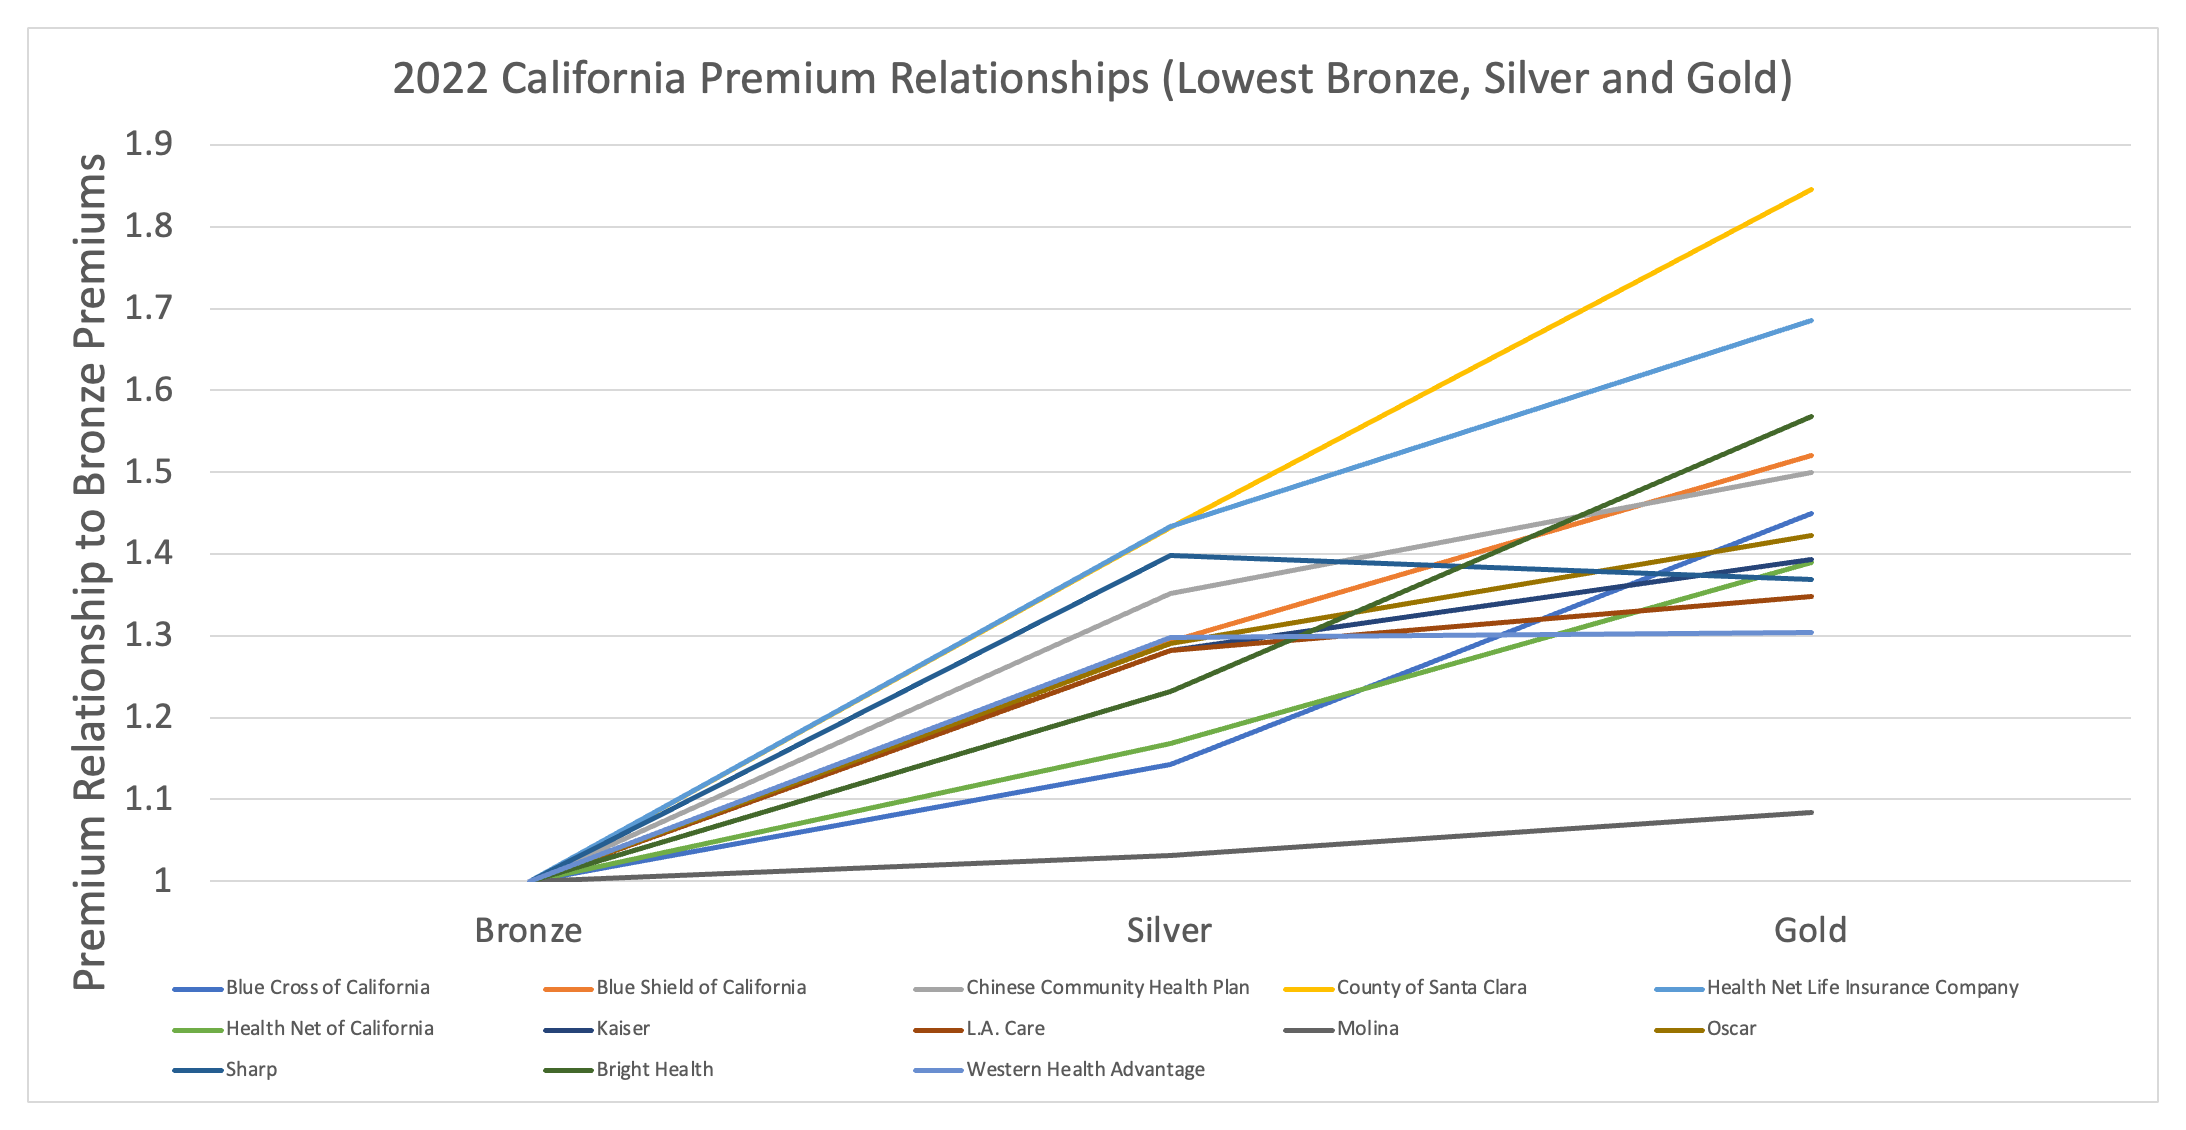
But is that true and what do the numbers say? Cutting through the known or accepted narrative, was one of the purposes of performing these state value rankings. So, let’s let the numbers do the talking and ponder what the results imply. Exhibit 6 below replicates Exhibits 3 (New Mexico) and 4 (Texas), showing the premium relationships between metal levels for each of the carriers offering coverage on the marketplace. California is unique in that plan designs are standardized so that when you look at the Gold to Bronze premium ratios for each carrier you are looking at the same exact plan designs for all carriers. In other words, the ratios reflect a range of pricing assumptions approved by Covered California, which acts as an active purchaser of coverage, for what the cost differential is between the same plan designs.
On the bottom end there is Molina which prices the Gold plan design at 8.4% higher than the Bronze plan design. At the top end there is the County of Santa Clara Health Plan which prices the difference for the same benefit plan designs at 84.6%. A disparity of 76% between pricing relativities, objectively speaking, is not an actuarially reasonable range of difference. Even if you got rid of those two potential outliers, the next low and high ranges would be 30.4% (Western Health Advantage) to 68.6% (Health Net Life Insurance Company) or a disparity of 38%. It would be difficult to actuarially explain anything beyond a 10% difference between carriers let alone 4 to 7 times that magnitude in difference. But that is the reality of the California marketplace.
Exhibit 6: 2022 California Metal Level Premium Relationships
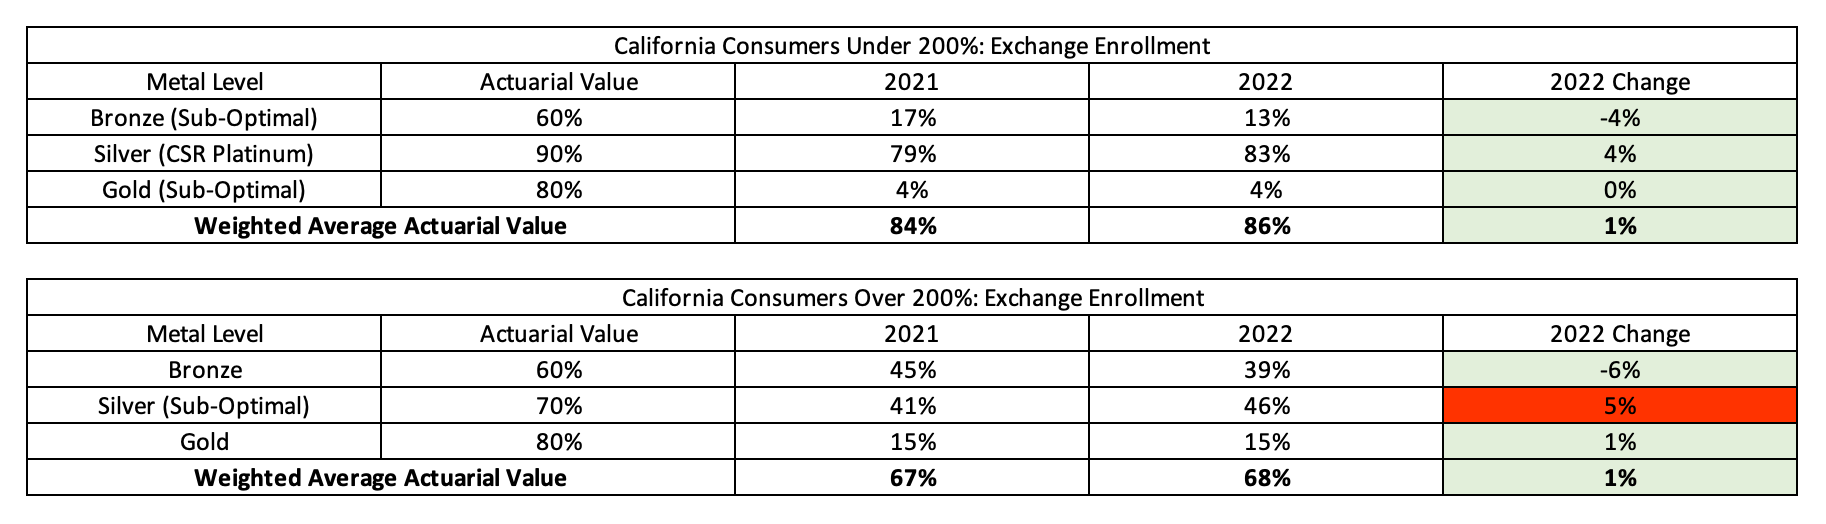
Far from not being able to game the system, the premiums suggest that health plans have perfected Metalball[29] in pursuit of profitable risk segmentation in the Golden State. Unfortunately, while other states like Texas have taken proactive steps in addressing violations of ACA pricing rules, California remains the Wild Wild West of premium alignment with pricing relationships varying dramatically and inappropriately between carriers. The result of this is higher consumer costs and the second (to New Jersey) highest percentage of sub-optimal consumer choice environments in the nation. This is highlighted by the 46% of consumers making over 200% of the FPL currently choosing the sub-optimal Silver plan (see Exhibit 7 below).
Exhibit 7: California Metal Level Selection Changes by Income Level 2021 to 2022
The premium relationships and resulting net consumer premiums are simply an objective reality that calls into question the great and powerful exchange[30] and the narrative surrounding the implementation of the ACA. However, Covered California has the authority to reverse course and can follow the lead of its Southwestern neighbors in implementing premium alignment. It may take new leadership or external pressure from those willing to pull back the curtain, but it will likely only be a matter of time until California once again becomes a leader in ACA consumer value.
Now for the rest of the country! The following is a brief overview of the value metrics used in the state rankings.
1st Value Category: Gold to Silver Premium Ratios
Metric Used: Average Lowest Gold to Silver premiums. This value category shows consumer access to richer benefit designs for consumers making above 200% of FPL. The lower the percentage, the lower the cost of Gold subsidized premiums.
2nd Value Category: Average Lowest Bronze Net Premiums (49-Year-Old, 300% of FPL)
Metric Used: Average Lowest Bronze Gross Premiums minus calculated subsidy for a 49-year-old individual making 300% of FPL. This value category shows the minimum consumer cost for being insured for a typical subsidized consumer above 200% of the FPL.
3rd Value Category: Average Lowest Gold Net Premiums (49-Year-Old, 300% of FPL)
Metric Used: Average Lowest Gold Gross Premiums minus calculated subsidy for a 49-year-old individual making 300% of FPL. This value category shows the minimum consumer cost for accessing a richer benefit design for a typical subsidized consumer above 200% of the FPL.
4th Value Category: Average Unsubsidized Costs (49-Year-Old)
Metric Used: Average of the Lowest cost Bronze and Lowest cost Gold gross premiums for a 49-year-old individual. This value category measures the average unsubsidized cost of coverage.
5th Value Category: Sub-Optimal Consumer Choice Percentage
Metric Used: The percent of exchange enrollees who have selected a sub-optimal metal tier. For consumers making under 200% of the FPL, sub-optimal choices are bronze or gold plan designs. The rationale for this is that Platinum coverage is subsidized for these consumers which can be received through the selection of Silver plans. For consumers making above 200% of the FPL, the sub-optimal choice is selecting a Silver plan. The rationale for this is that silver enrollees above 200% of the FPL subsidize the platinum level coverage of consumers under 200% of the FPL through higher premiums and therefore should find greater value in either bronze or gold plan designs.
Overall Value:
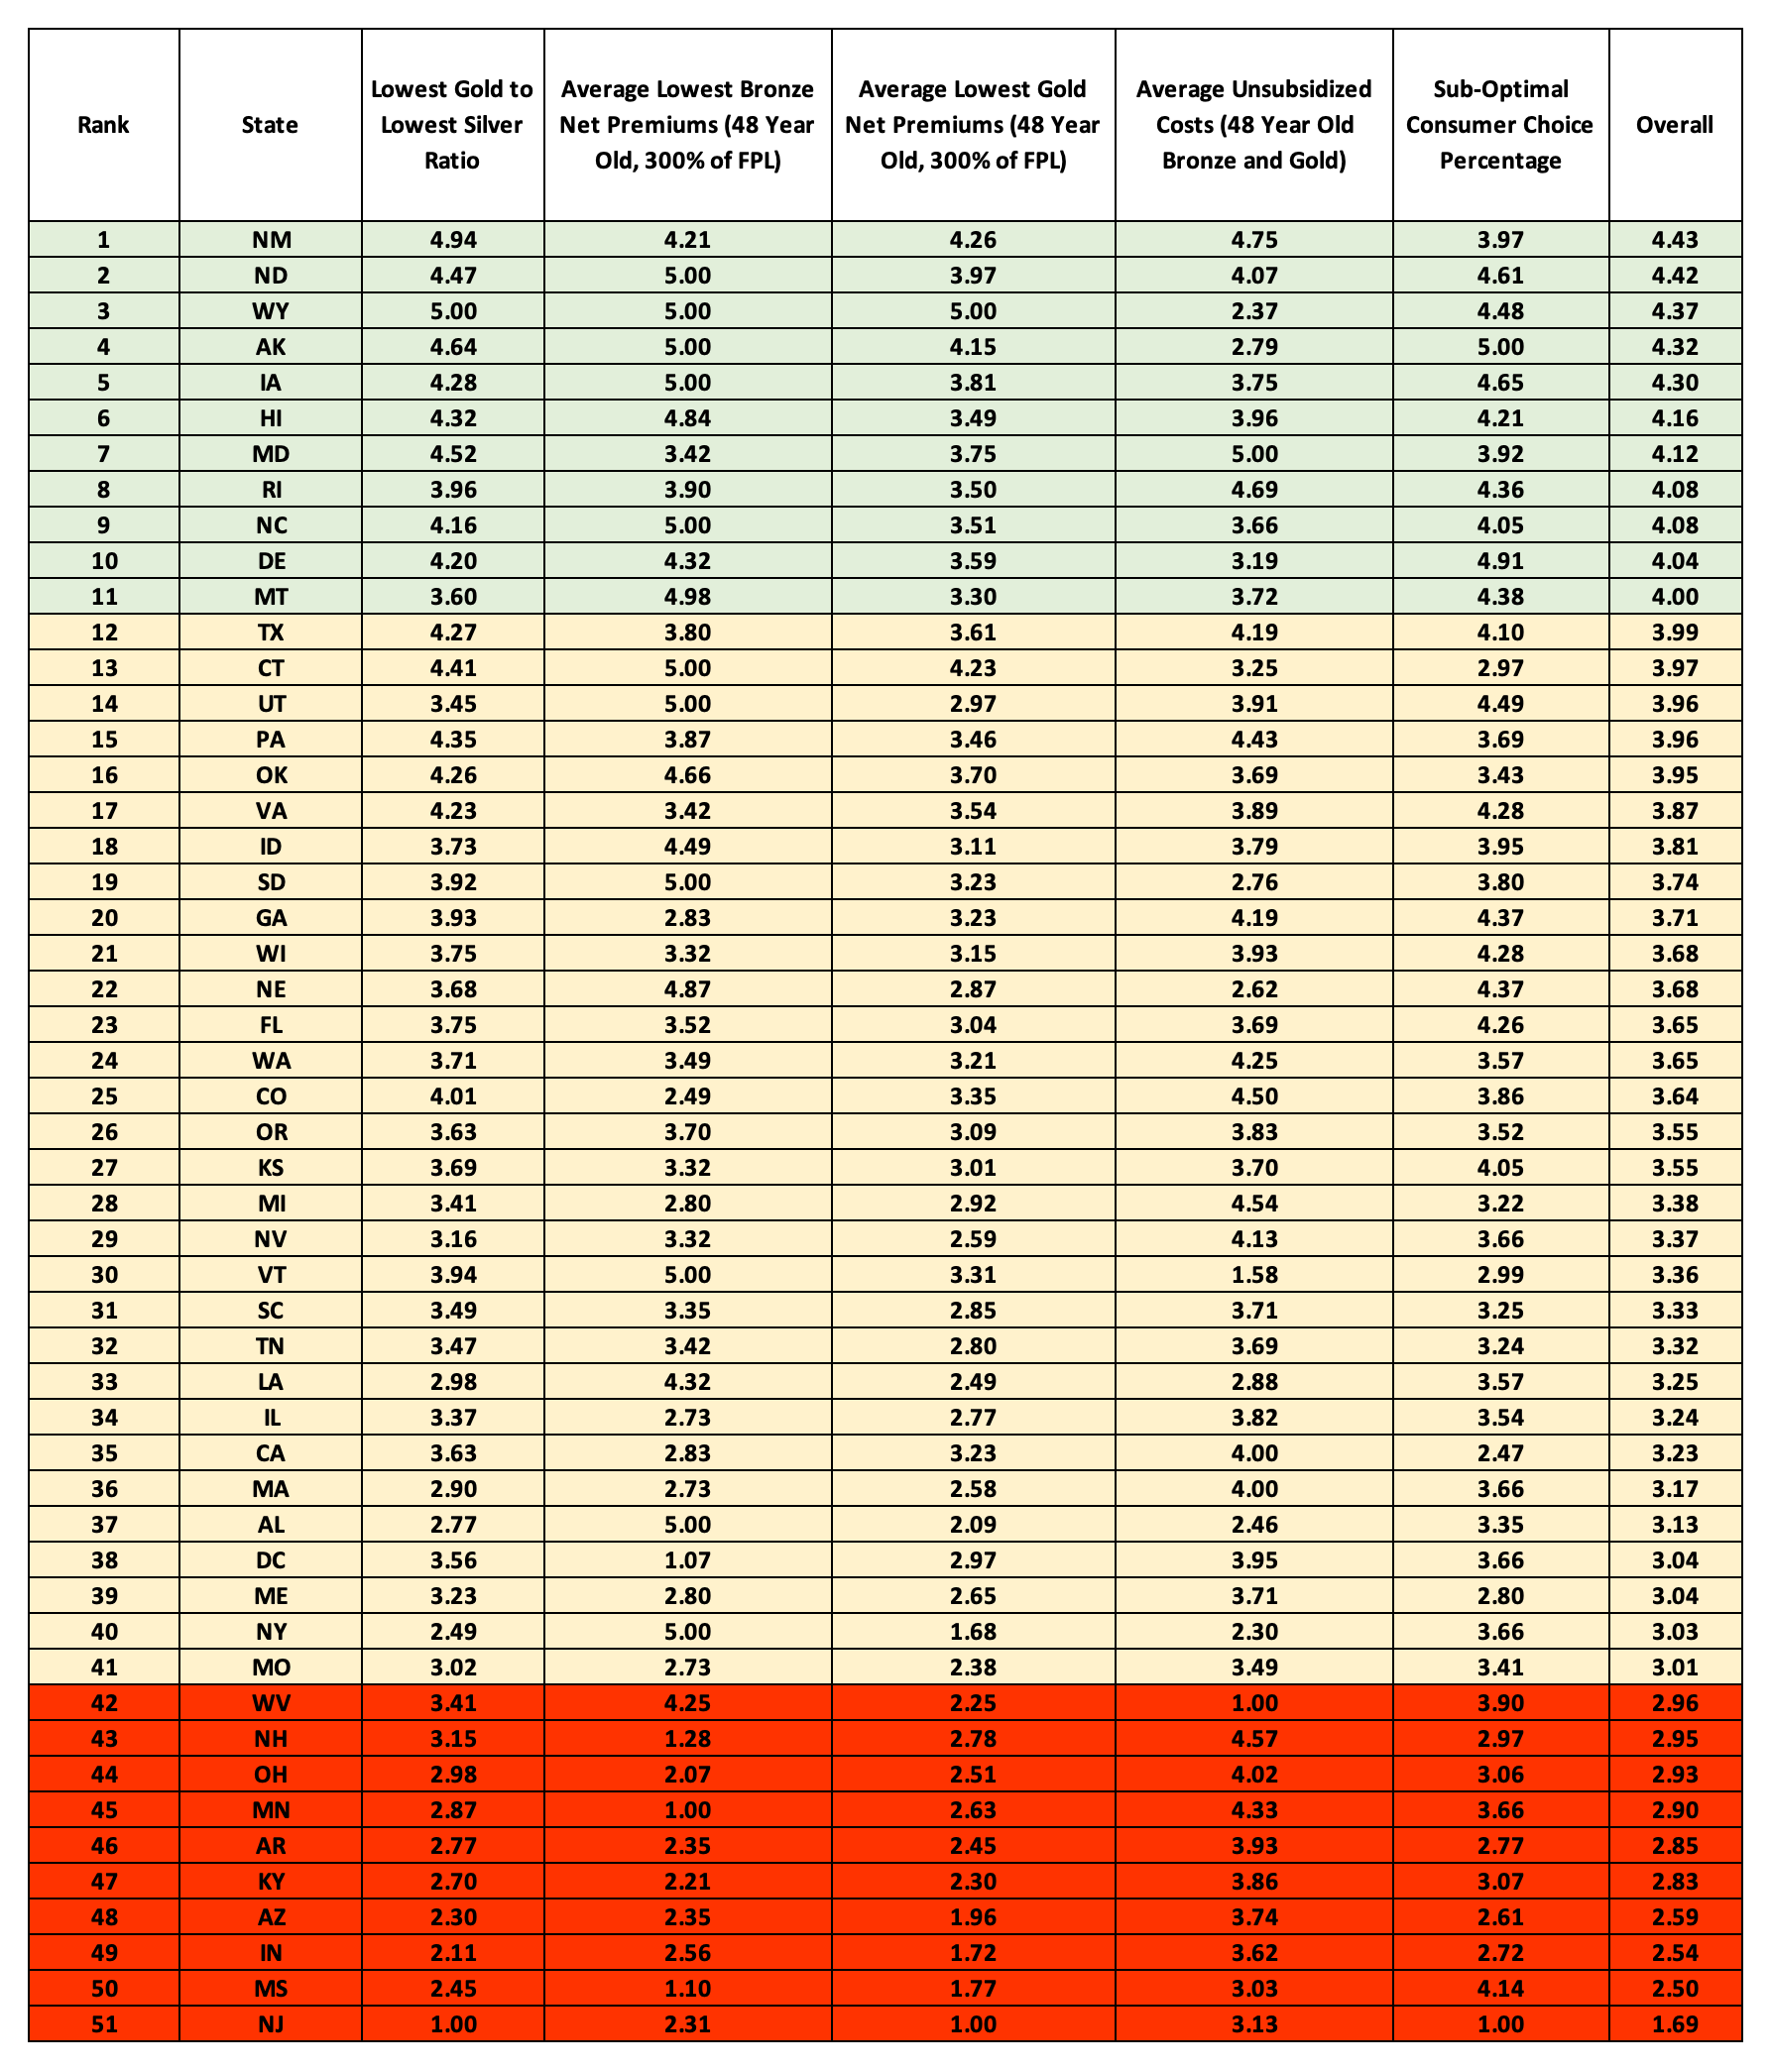
For each value category, the state with the minimum value metric receives a 1.0 value score and the state with the maximum value metric receives a 5.0 value score. All value metrics in between receive a value score based on a linear interpolation between the minimum and maximum state value metrics. The overall value score reflects the average value score of the five value categories. The green highlighted states in the tables below represent those with overall values of greater than 4.0, the yellow colored states have overall value scores of 3.0-3.99 and the red colored state have scores below 3.0.
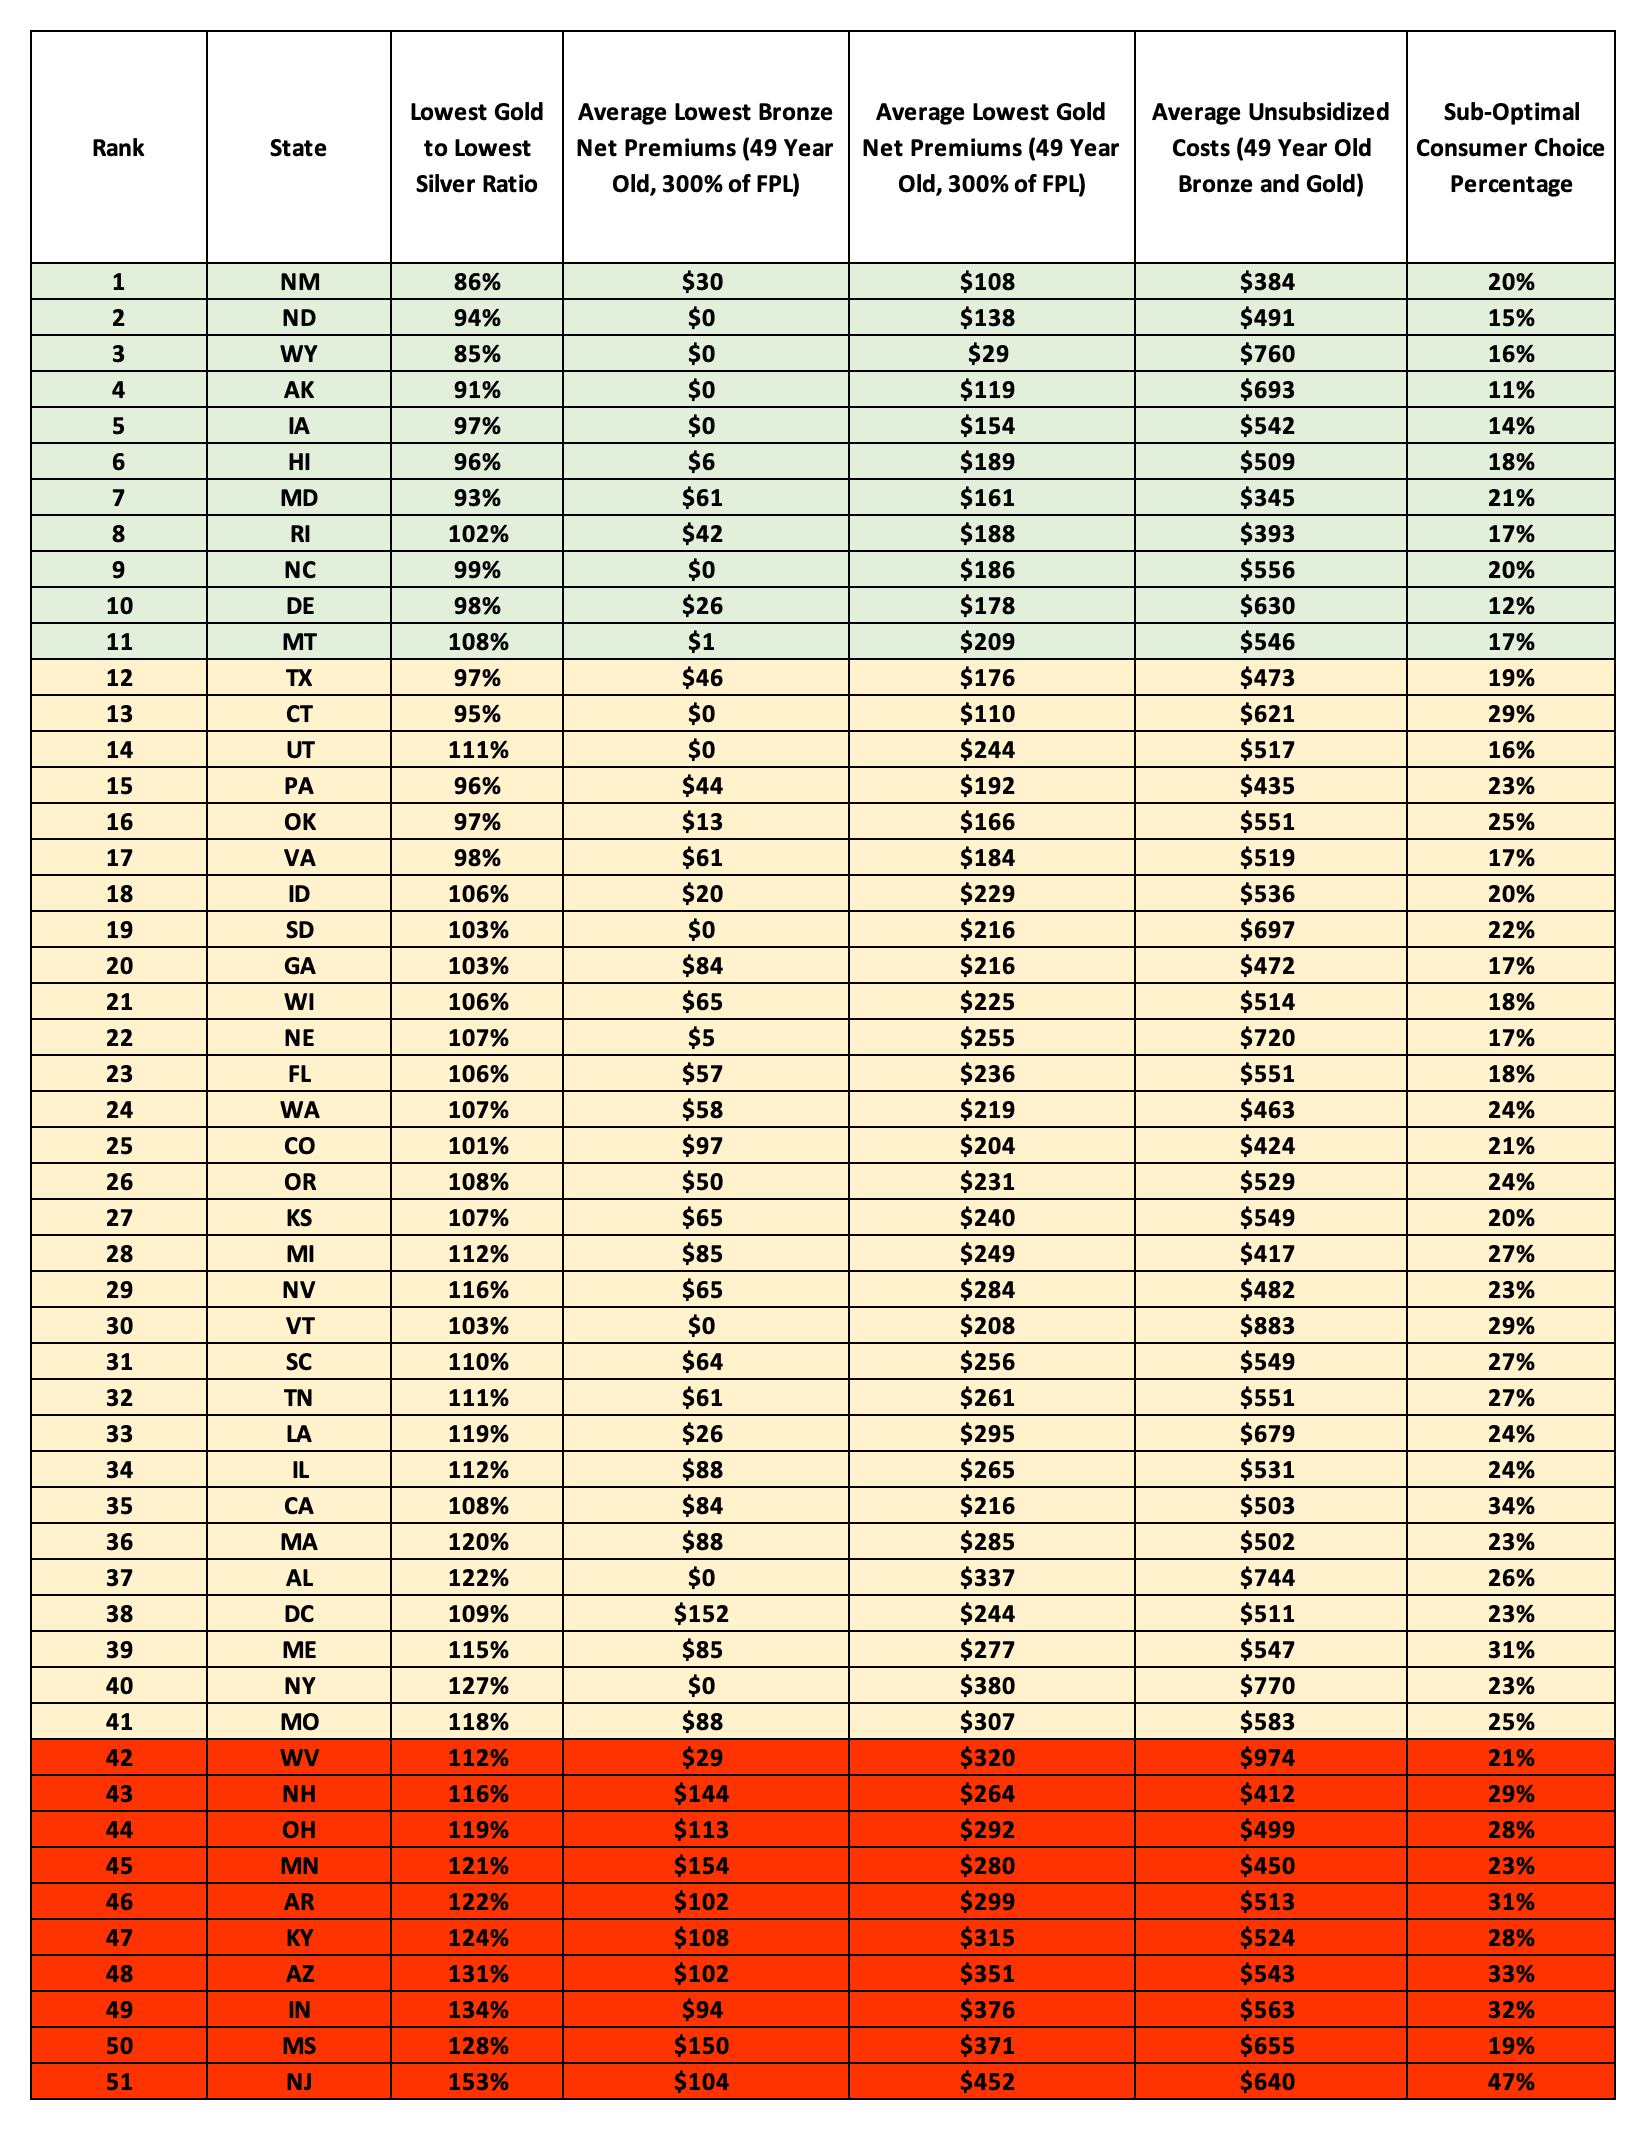
State Ranking – Value Score Metrics
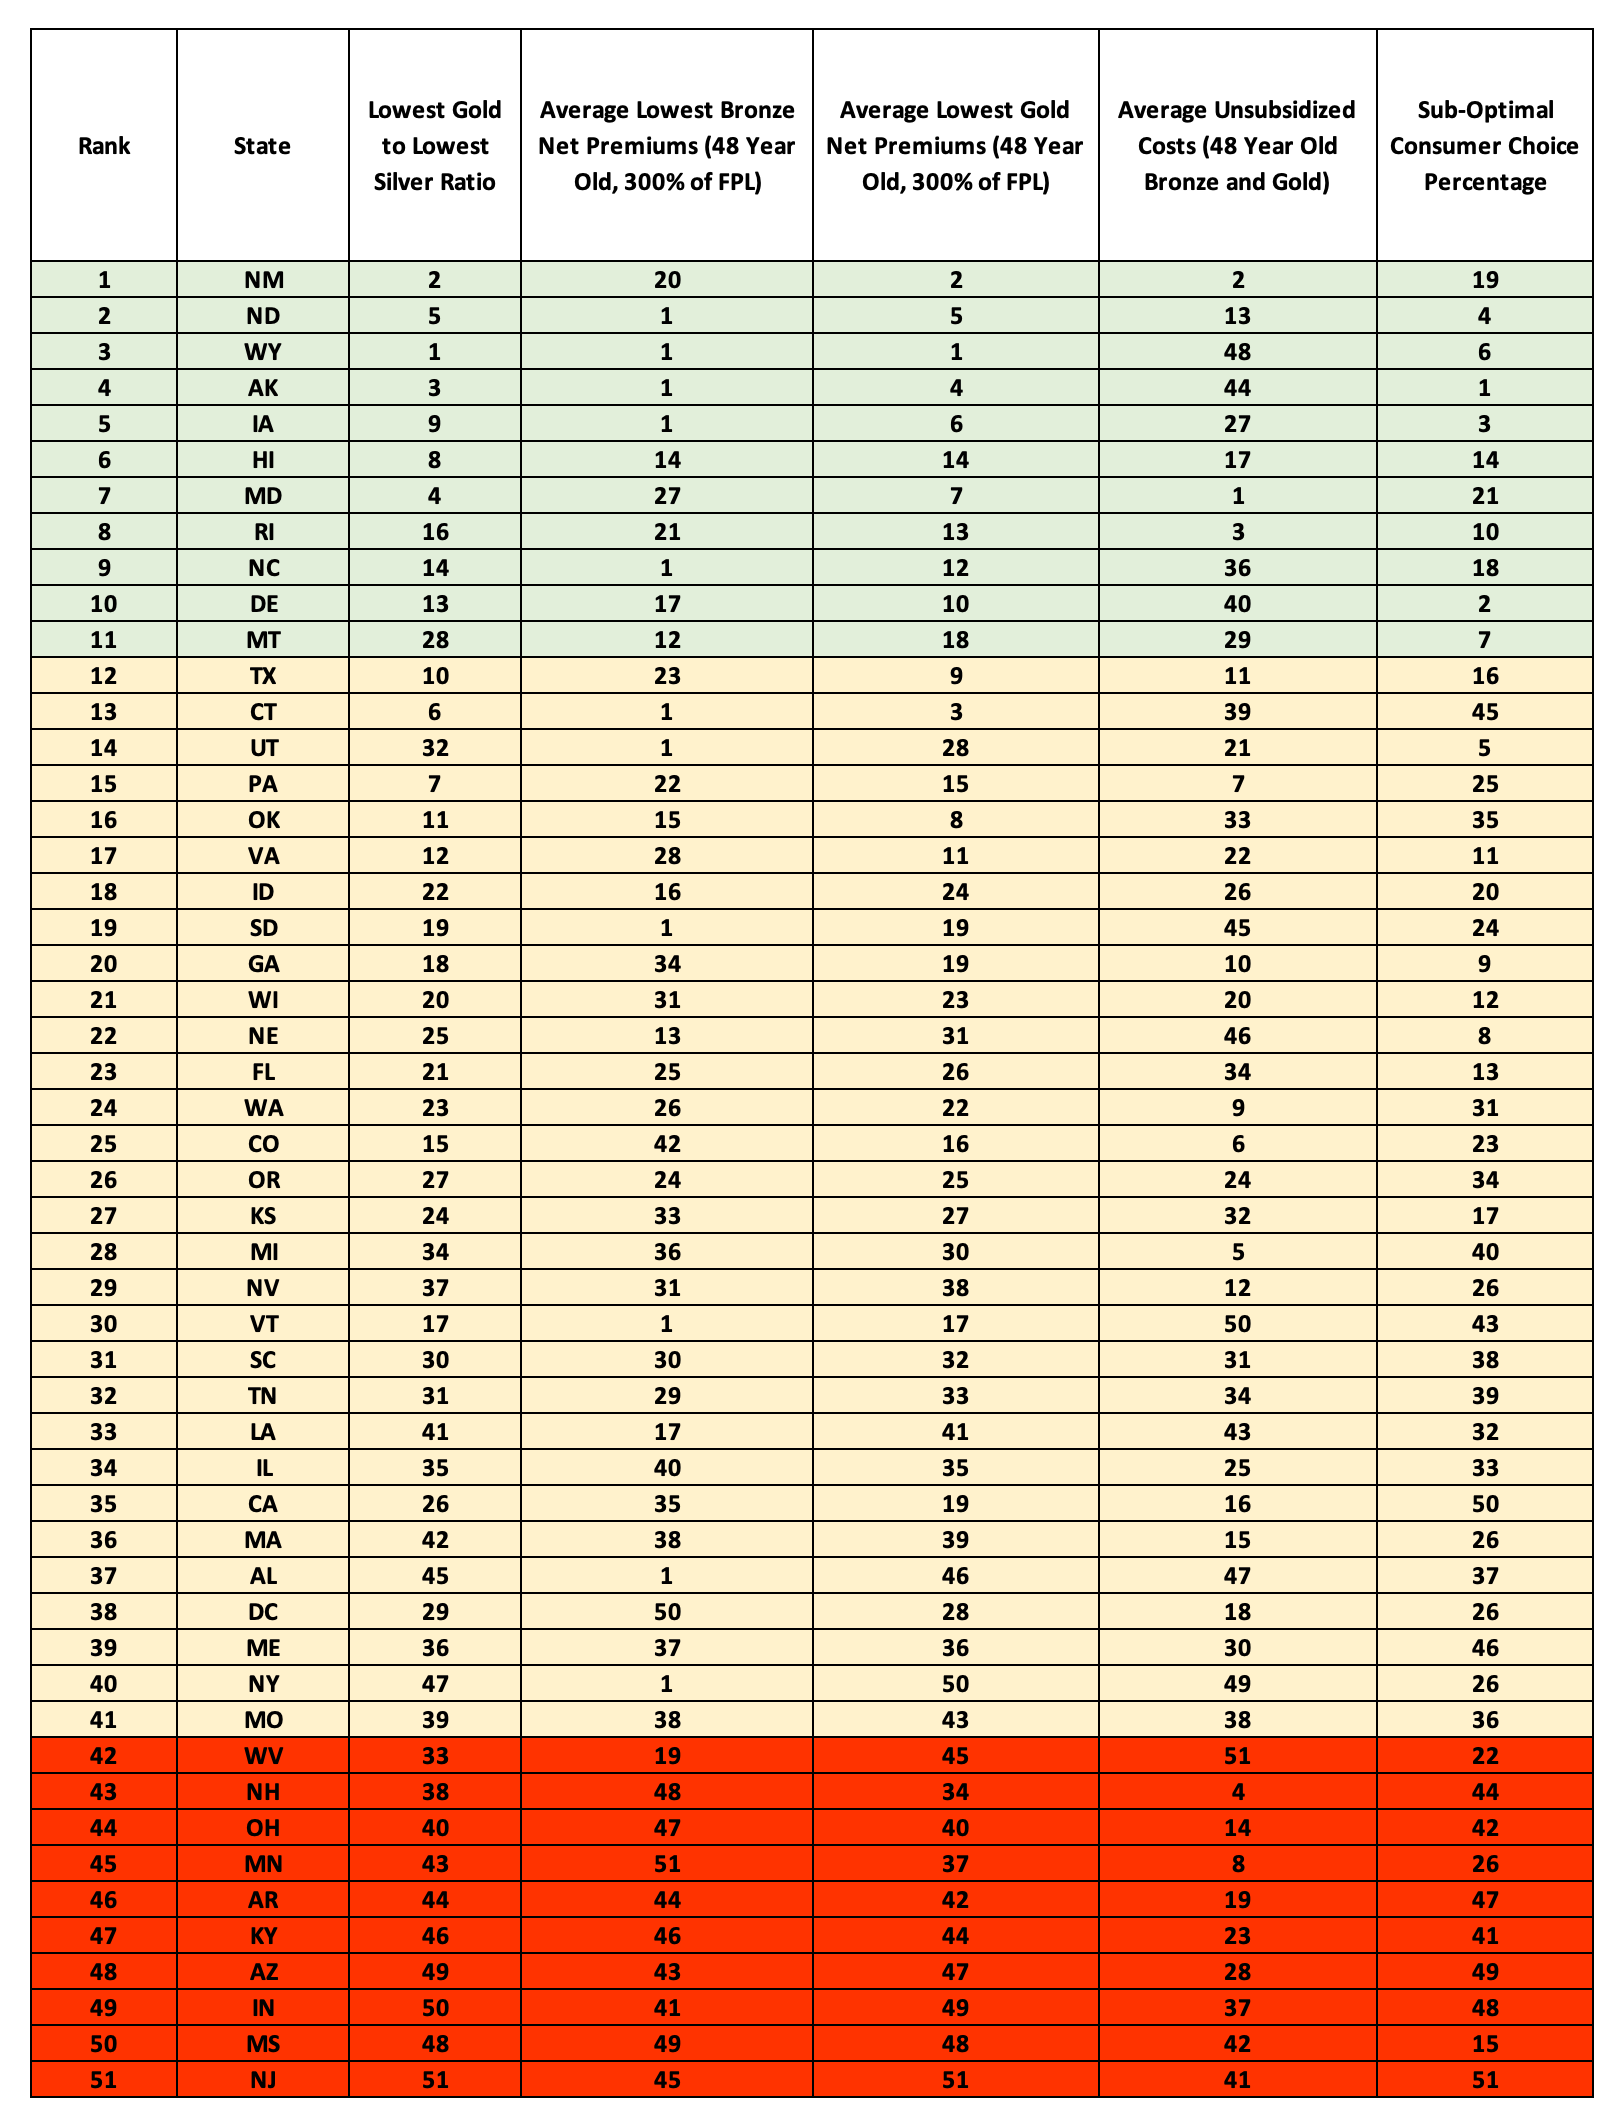
The following table displays the results of my analysis and the value score metrics used for each state in each category. This table allows the reader to see the metric differences for each category between states.
State Ranking – Value Scores
The following table displays the value score results for each state in each category. This table allows the reader to see how the overall value score and overall state rankings were developed.
State Ranking – Value Score Rankings
The following table displays the value score rankings for each state in each category. You can see where each state ranks nationwide for each of the value categories.
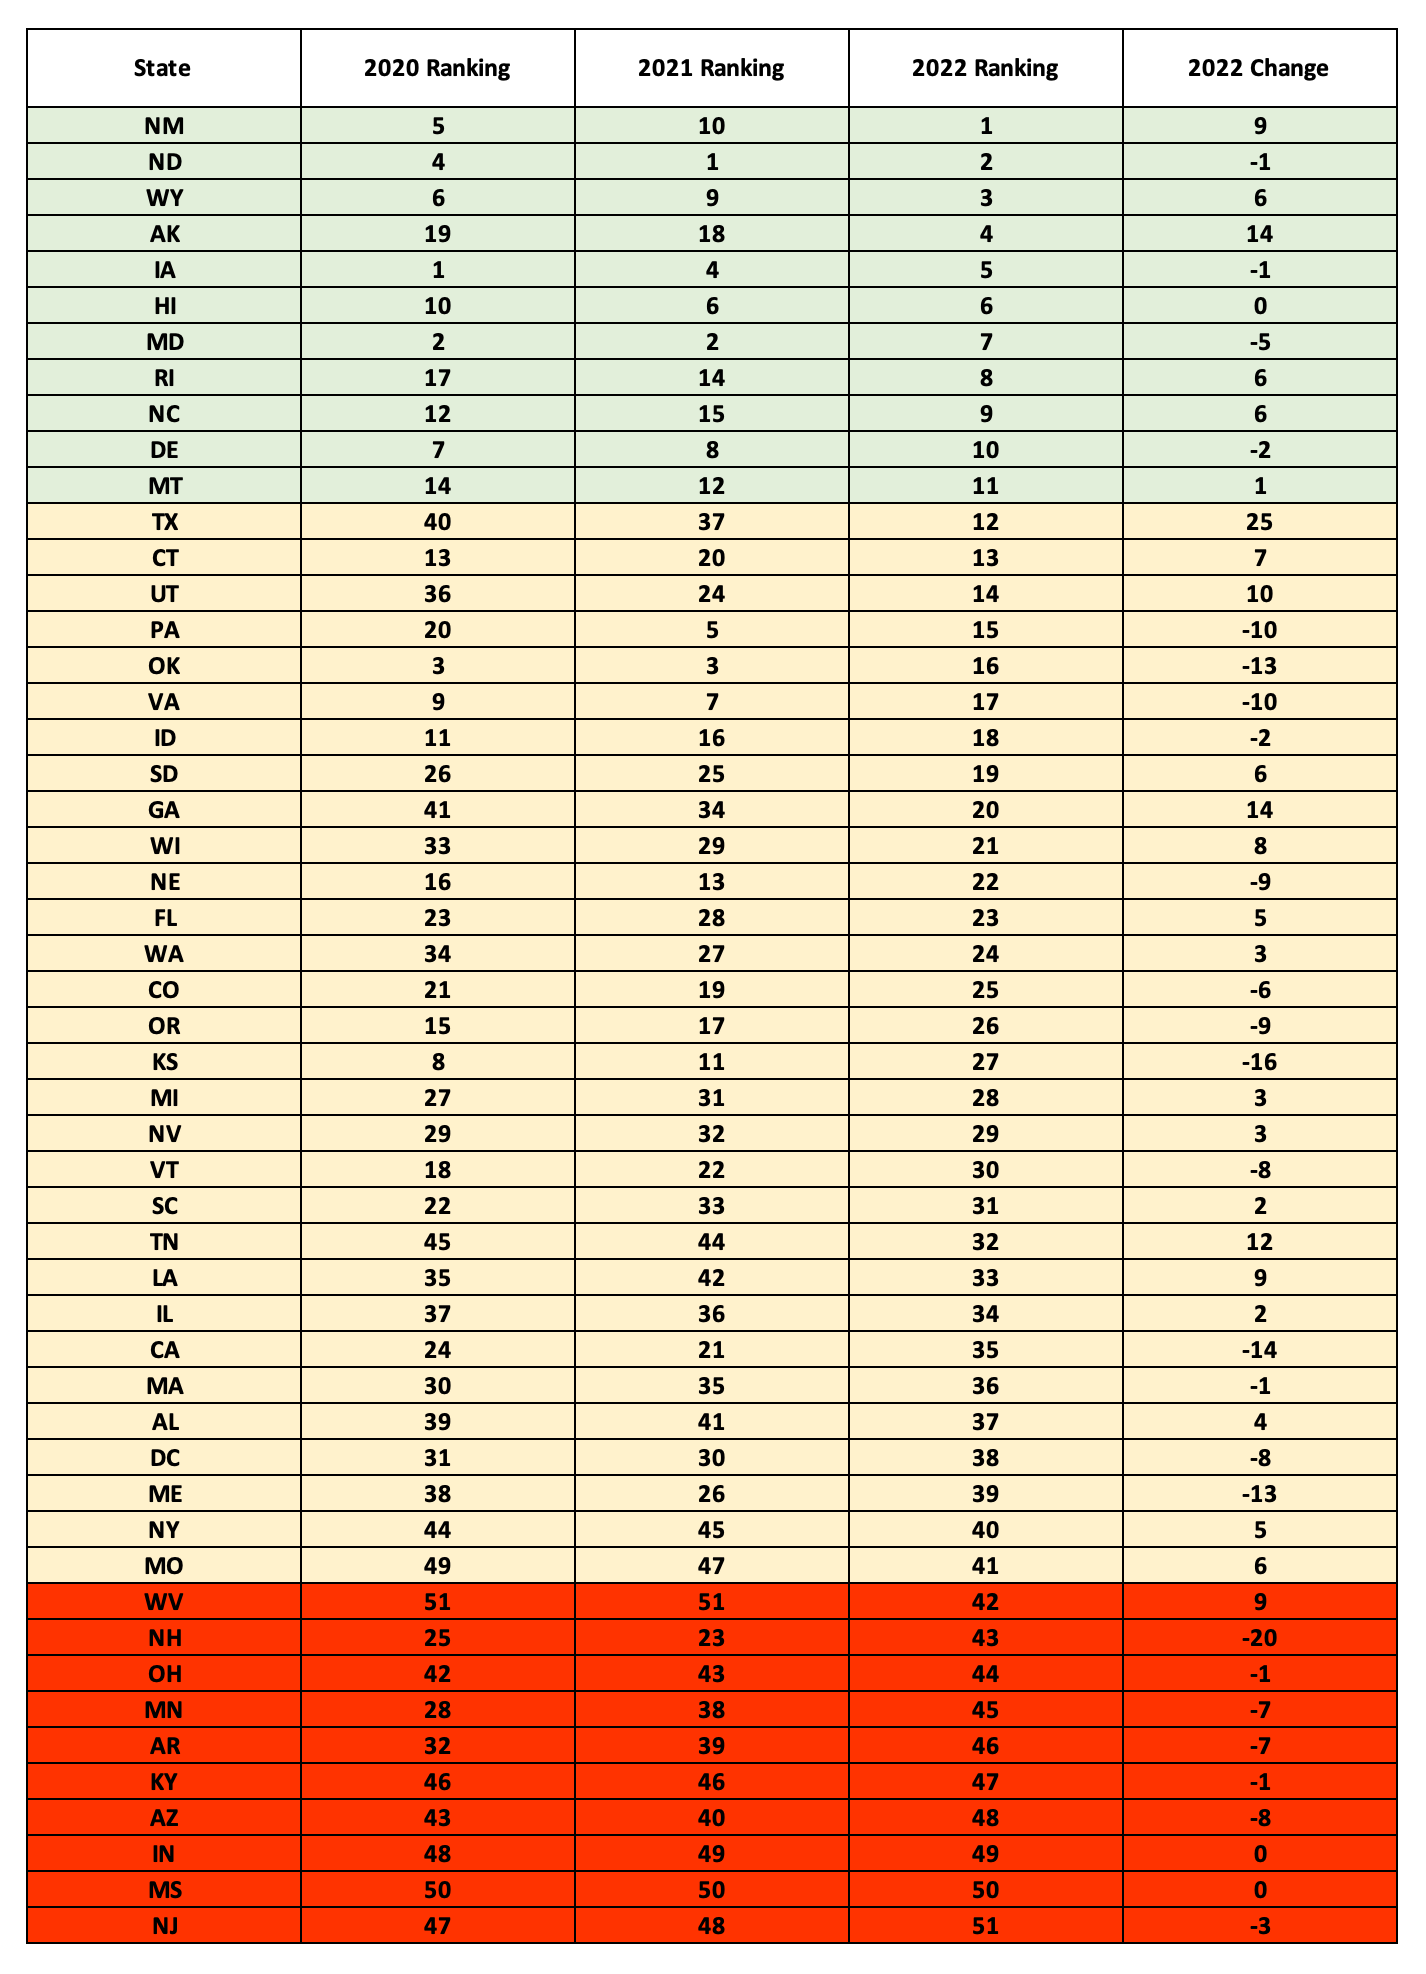
State Ranking – Change in Rankings
The final table displays the overall value state rankings for each year and the 2022 change from 2021.
Endnotes
[2] https://axenehp.com/acas-silver-bulletin/
[4] OSI-2022-Rate-Guidance-Final-05282021.pdf (state.nm.us)
[5] ASPE_IB_CSRs.pdf (hhs.gov)
[8] https://axenehp.com/fields-of-gold/
[9] https://axenehp.com/gold-rush-lionfish-optimizing-unique-dynamics-aca-markets/
[10] https://axenehp.com/2nd-annual-aca-consumer-value-state-rankings/
[11] All exchange enrollment comes from the CMS marketplace enrollment public use files – https://www.cms.gov/research-statistics-data-systems/marketplace-products/2022-marketplace-open-enrollment-period-public-use-files
[12] https://axenehp.com/aca-math-and-2020/
[13] https://axenehp.com/hard-pill-to-swallow/
[14] https://axenehp.com/joe-pesci-option/
[15] CSR is short for Cost Sharing Reduction. CSR enrollees are consumers who qualify for the CSR 87 or CSR 94 Silver variant plan designs which are available for consumers making under 200% of the FPL. CSR 73 consumers are considered to have negligible benefit in selecting the Silver variant plan and are therefore not considered as part of the “CSR enrollees”.
[17] https://axenehp.com/making-rate-review-great/
[18] Gross premiums used to calculate these values were taken from the Kaiser Family Foundation – https://www.kff.org/health-reform/state-indicator/average-marketplace-premiums-by-metal-tier/
[19] For simplicity, the standard AV values found in the CMS risk adjustment factors were used to calculate the weighted average actuarial value.
[21] From Worksheet 2, field name ADJ_FACT_AV_CS. 2022 URRT PUF: https://www.cms.gov/CCIIO/Resources/Data-Resources/marketplace-puf
[22] Scale is kept to 1.9 in order to incorporate California’s maximum value of 1.9.
[23] https://axenehp.com/actuaries-versus-experts-lost-sheep-astray-route-aca/
[24] https://axenehp.com/focused-aca-rate-review/
